Strong headwinds en route to achieving the Sustainable Development Goals

Bernhard Obenhuber
Jul 03, 2021

While it would be premature to declare the COVID-19 pandemic almost over, the acceleration of vaccination rates has allowed many of us to dare to believe we’re at least at beginning of the end. And as the restrictions on people’s daily lives begin to fall away, the global economy has also gathered pace and appears to be on firmer ground than it was a year ago.
However, if we take a global perspective, the massive impact of the pandemic continues to rear its head.
Quantifying the setback
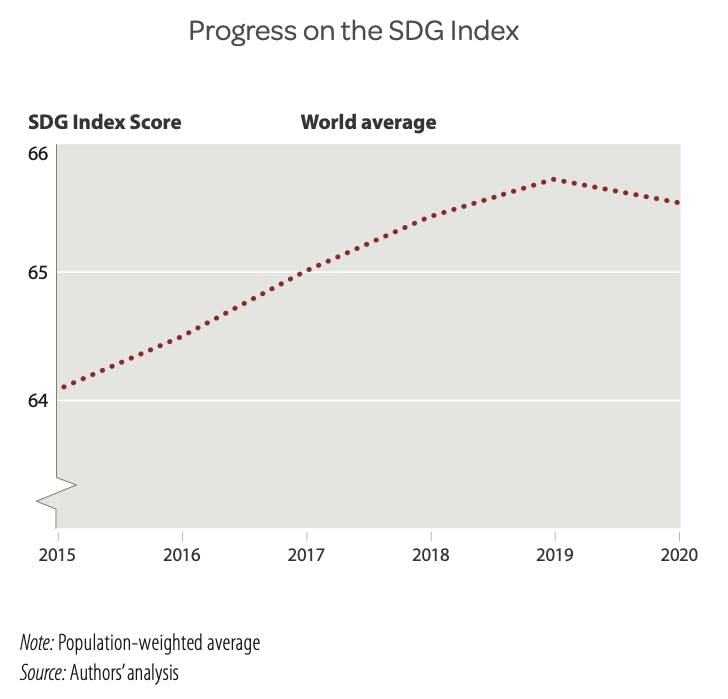
The latest update to the Sustainable Development Goal (SDG) Index, which provides a country-by-country SDG progress summary, paints a startling picture of the consequences of COVID-19. The authors write that, for the first time since the SDGs were adopted in 2015, the SDG Index deteriorated in 2020 compared to 2019, as shown in the chart below.
Guillaume Lafortune from the UN Sustainable Development Solutions Network (SDSN), author of the SDG Report 2021, said,
“The COVID-19 pandemic is a setback for sustainable development everywhere. For the first time since the adoption of the SDGs by the global community in 2015, the world average SDG Index declined in 2020. This was largely driven by the rise in poverty rates and unemployment. The SDGs provide the right vision for building ‘forward’ better—green, digital, and resilient. Developing countries require additional fiscal space to finance the emergency response to the pandemic and the investment-led recovery.”
The decline in the SDG Index means that we’re now further away from achieving the SDGs than we were before the pandemic. Worse, the deterioration is also very likely to have been underestimated, as many of the SDG Index input statistics were unavailable for the latest update due to reporting lags.
The setback is especially acute for SDG 1: No Poverty, which, as shown below, shows a significant overall decline compared to the previous SDG Index update.
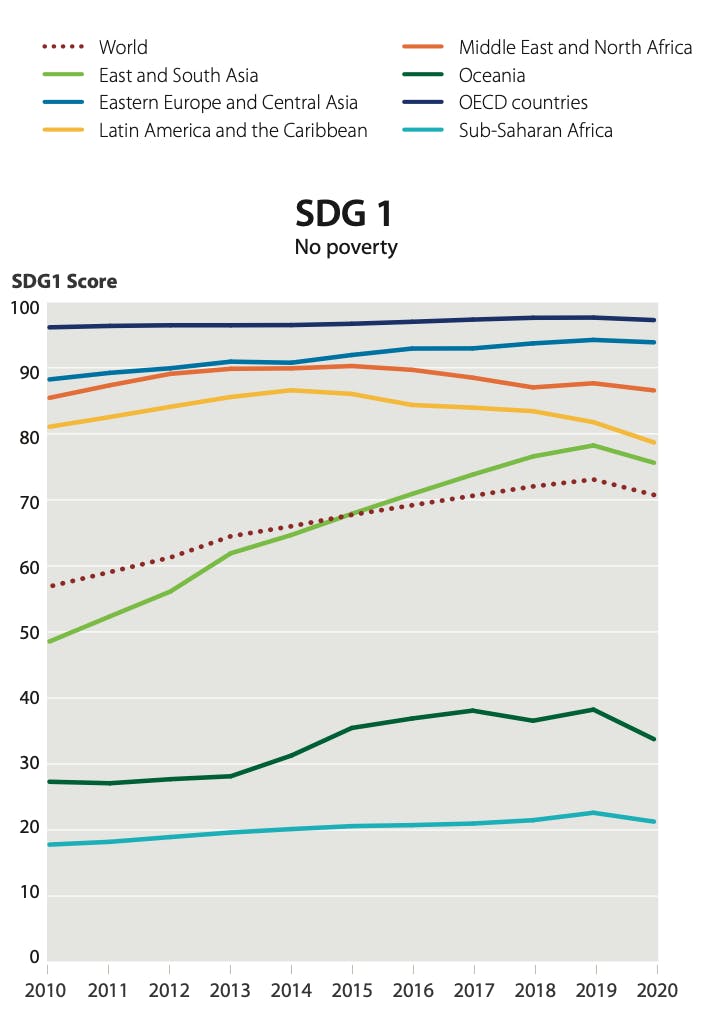
The same pattern is reflected in the SDG 1 scores for every region except Latin America & the Caribbean and Middle East & North Africa, whose scores had already been deteriorating for several years before the pandemic. Much of the increase in poverty in Latin America can be attributed to the multi-year Venezuelan economic and social crisis.
Finland takes the top spot
Looking at the league table of the SDG Index is an unsurprising affair. The top ten countries are all European, with the Nordic countries occupying four spots in the top ten and all of the top three.
But with a score of 85.9, even the SDG Index’s top-ranked country, Finland, is still a way off achieving all of the SDGs. While it’s important to note that the SDG Index indicators aren’t fully aligned with the official SDG indicator targets, it’s still, in our view, the best available approach to measuring progress towards achieving the SDGs.
There are also no surprises to be found at the other end of the SDG Index, which remains dominated by African countries such as Central African Republic, Chad, Somalia and South Sudan. Here, scores in the 40s and even the 30s indicate a long road ahead.
What’s your use case?
As we wrote in a previous blog about the challenges of constructing ESG and SDG indexes, (Link to blog post), there is typically a broad consensus around which countries should occupy the top- and bottom-most spots. The middle-rankings, though, are more contentious.
For example, New Zealand and Belarus have broadly the same score, and Singapore ranks only 76th out of 165 countries while Ukraine ranks 36th, just below the United States. Do these rankings make sense? As is often the case, the answer is: it depends on what you plan to do with the information.
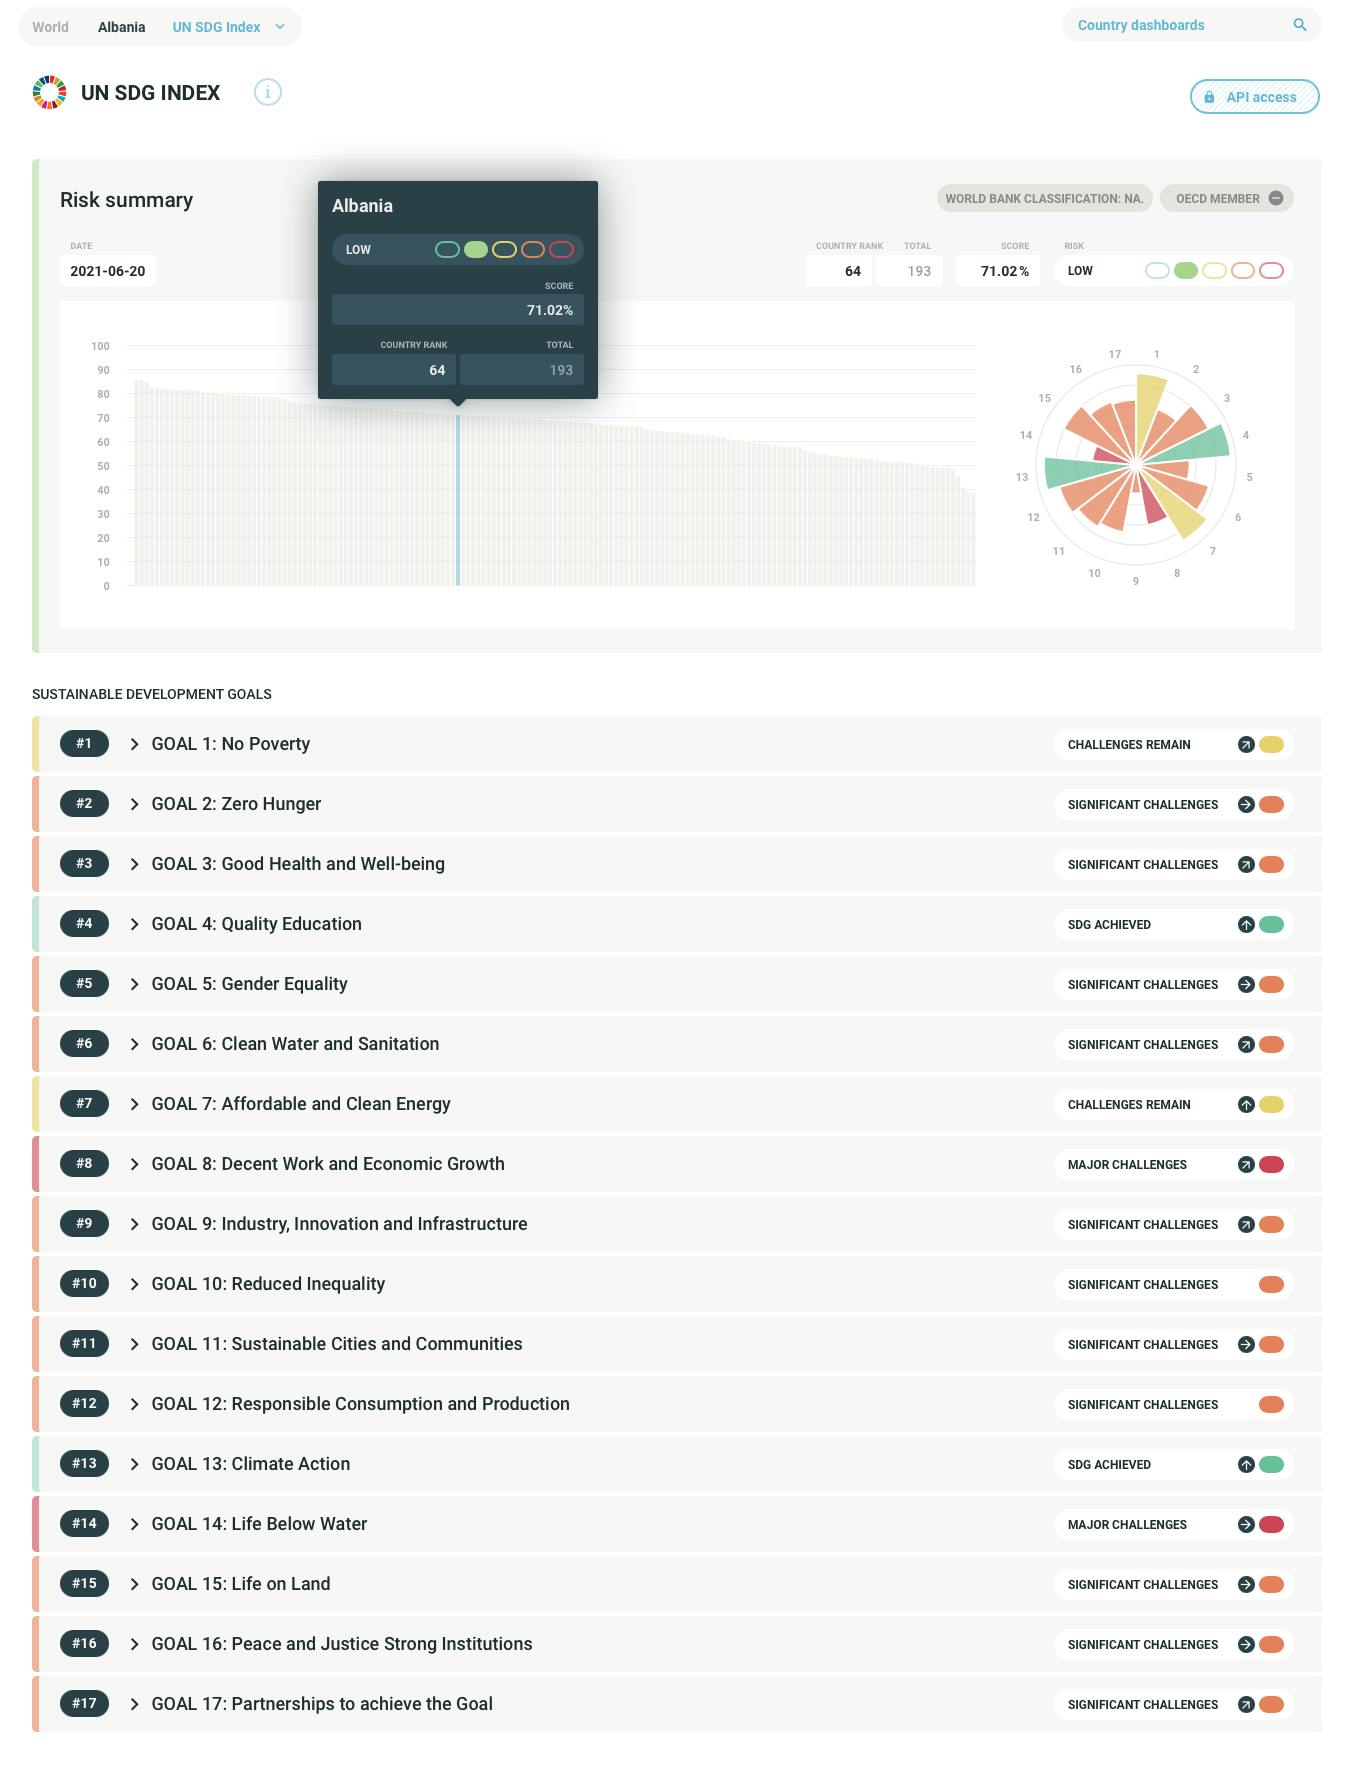
At CountryRisk.io—as mentioned earlier—we find the SDG Index to be the best available approach to ranking countries in terms of their progress towards achieving the SDGs. That’s why we integrate the SDG Index into our platform, as illustrated in the screenshot below. You can register for CountryRisk.io for free here.
When it comes to other use cases, such as constructing a portfolio of government bonds, deciding how to use such data becomes more tricky. Clearly, we shouldn’t make direct use of it by weighting our portfolios towards those countries with the highest SDG Index scores, not least because this wouldn’t be in keeping with the spirit of sustainable finance—after all, the countries most in need of capital to promote sustainable development will also be those that score lowest.
And yet, the opposite approach—weighting our portfolios towards those countries with the lowest SDG scores and hoping for more significant progress—also doesn’t sound like a good investment strategy. Meanwhile, a third option is to favour countries that show the strongest positive momentum in the SDG Index.
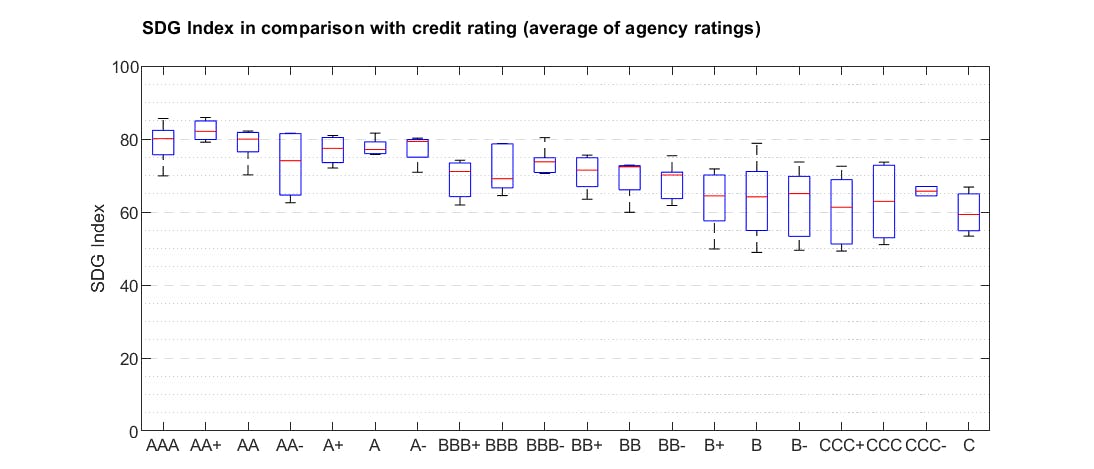
SDG Index and credit ratings
The chart below encapsulates the challenge of using SDG data in the context of sovereign credit risk. Here, we can see only a very loose relationship between countries’ SDG Index scores and their sovereign ratings. While higher-rated countries tend to have better credit ratings, on a more granular level, the SDG Index isn’t much help when it comes to differentiating between rating buckets.
Integration of SDG/ESG factors into sovereign credit risk
But there is a fourth strategy, one that we at CountryRisk.io find to be well-suited to sovereign credit risk assessments: the fully integrated approach.
It’s important to stress that our objective is to assess the credit default risk of government bonds. We do this by identifying those indicators that impact credit risk, which includes a range of commonly used indicators such as economic wealth (i.e. GDP per capita), government debt & affordability ratios and institutional quality. But we also integrate ESG indicators, according to two principles:
- Empirical evidence: Can we show statistically that an indicator is useful in assessing and predicting sovereign default risk? In short, we conduct an empirical financial materiality test.
- Theoretical considerations that link a given indicator to the key drivers of debt (un-)sustainability: indebtedness and wealth (financial assets, environmental wealth, social/human capital), future growth prospects, fiscal outlook, interest rates or general risk premiums.
By applying these two principles, we end up with a smaller set of ESG indicators than the SDG Index’s. We group these indicators into six categories:
- Governance (quality of institutions)
- Climate change and renewable energy
- Biodiversity
- Health and poverty
- Education and social aspects
- Labor market and social safety systems
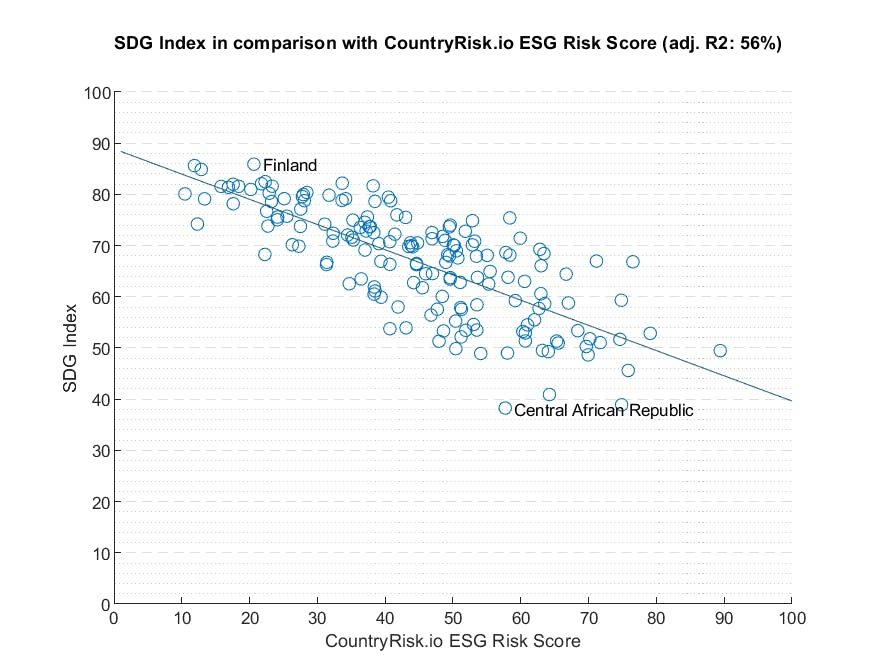
When we compare the CountryRisk.io ESG score with the SDG Index, we see some correlation but also some dispersion due to the integration of standard sovereign risk variables. As a result, while Finland and Central African Republic are, respectively, the top- and bottom-performing countries in the SDG Index, this isn’t the case from a sovereign default perspective.
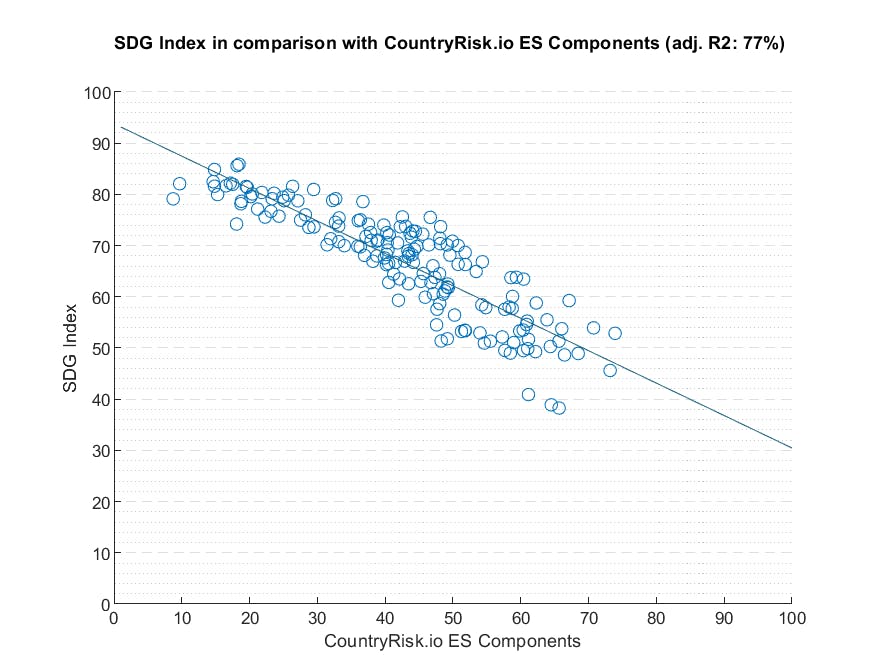
Meanwhile, if we only compare the E- and S-components of our risk score with the SDG Index, we get a much stronger correlation.
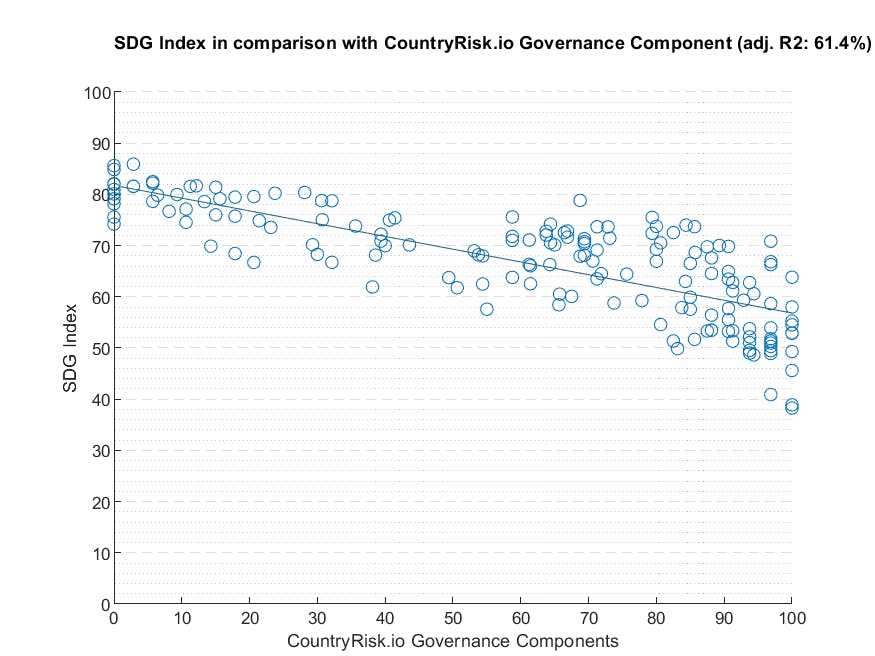
Interestingly, governance indicators like rule of law, corruption and regulatory quality show a weaker correlation with the SDG index. While such indicators are among the most important for sovereign credit risk assessments, they’re only reflected in the SDG Index indirectly.
We need more than statistics
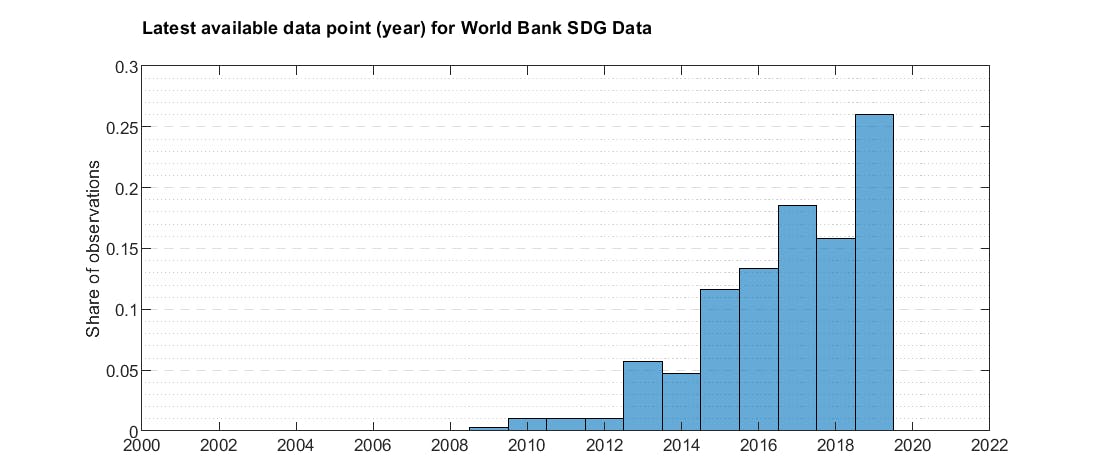
A big problem with integrating environmental and social risk factors into sovereign credit risk assessment is data quality, in terms of timeliness, country coverage and methodological consistency over time. When we look at the World Bank SDG database, we find that, for many indicators, the latest data are from 2016 or even older. Data availability is somewhat better for the World Bank ESG database that is more limited in terms of indicators but we are far away from data timeliness that we are used to in other ares like GDP reporting.
When it comes to our own CountryRisk.io ESG Sovereign Risk Score, we’re acutely aware of these data quality issues. That’s why we recommend it for two use cases:
- To monitor a large set of countries;
- To conduct more comprehensive due diligence.
Our rating model incorporates not only most of the quantitative indicators found in the Risk Score but also many qualitative factors that focus on the forward-looking assessment of government policies, from fiscal aspects to carbon-neutral and inclusive education policies. The authors of the latest SDG Index publication also stress the importance of incorporating an assessment of the commitment and quality of government policies:
“The SDG Index and Dashboards focus on internationally standardized outcome statistics. Due to data gaps and time lags in international reporting, national policies and commitments must also be considered in gauging a country’s efforts to achieve the SDGs.”
Such an integrated approach that combines quantitative and qualitative aspects is time-consuming and requires knowledge about a wealth of topics. But while there’s no shortcut to a diligent analysis, it’s possible to avoid some of the drudgery, such as model building & maintenance and data wrangling. At CountryRisk.io, our goal is take care of the tools, models and data our members need, leaving them to focus on analysing country risk.