How to use our Sovereign Risk Score in a fundamentals-to-spread model

Bernhard Obenhuber
Jun 09, 2022

In this blog post, we’ll show you how you can use the CountryRisk.io Sovereign Risk Score (SRS) to estimate a fair credit spread of sovereigns and derive valuation signals.
What is the SRS?
The SRS is a quantitative measure of sovereign credit risk based on a wide range of macro-economic indicators. It’s available for around 200 countries, updated monthly, and backdated through to the 1990s. The SRS ranges from 0 to 100, with higher values indicating higher risk. You can read more about our methodology here.
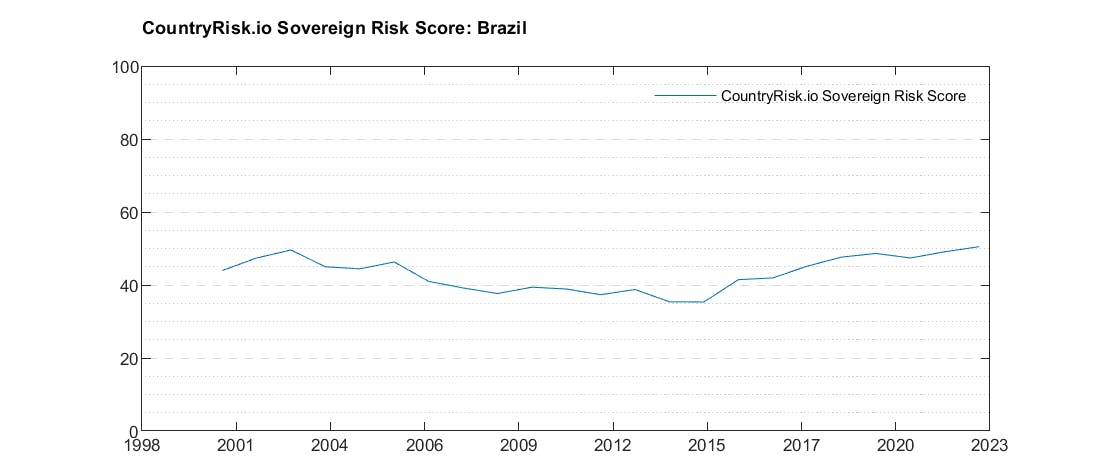
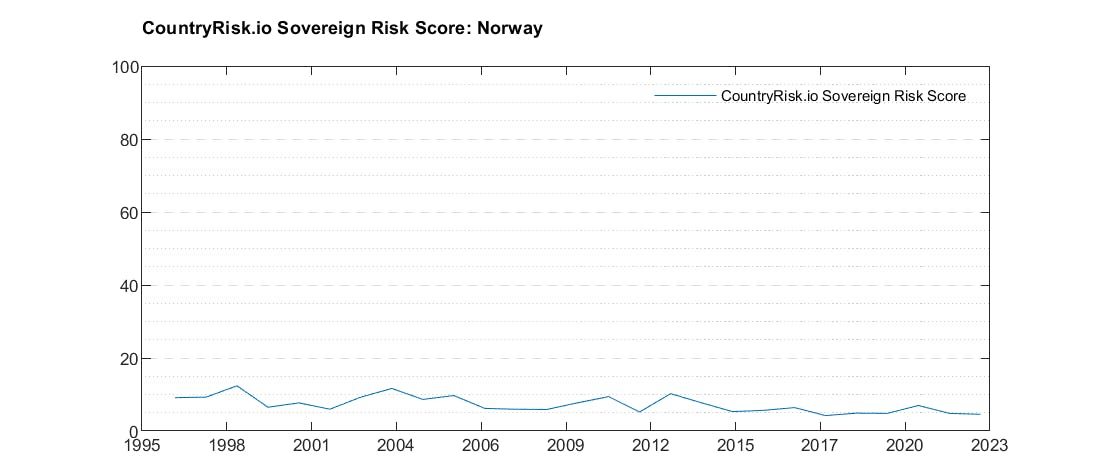
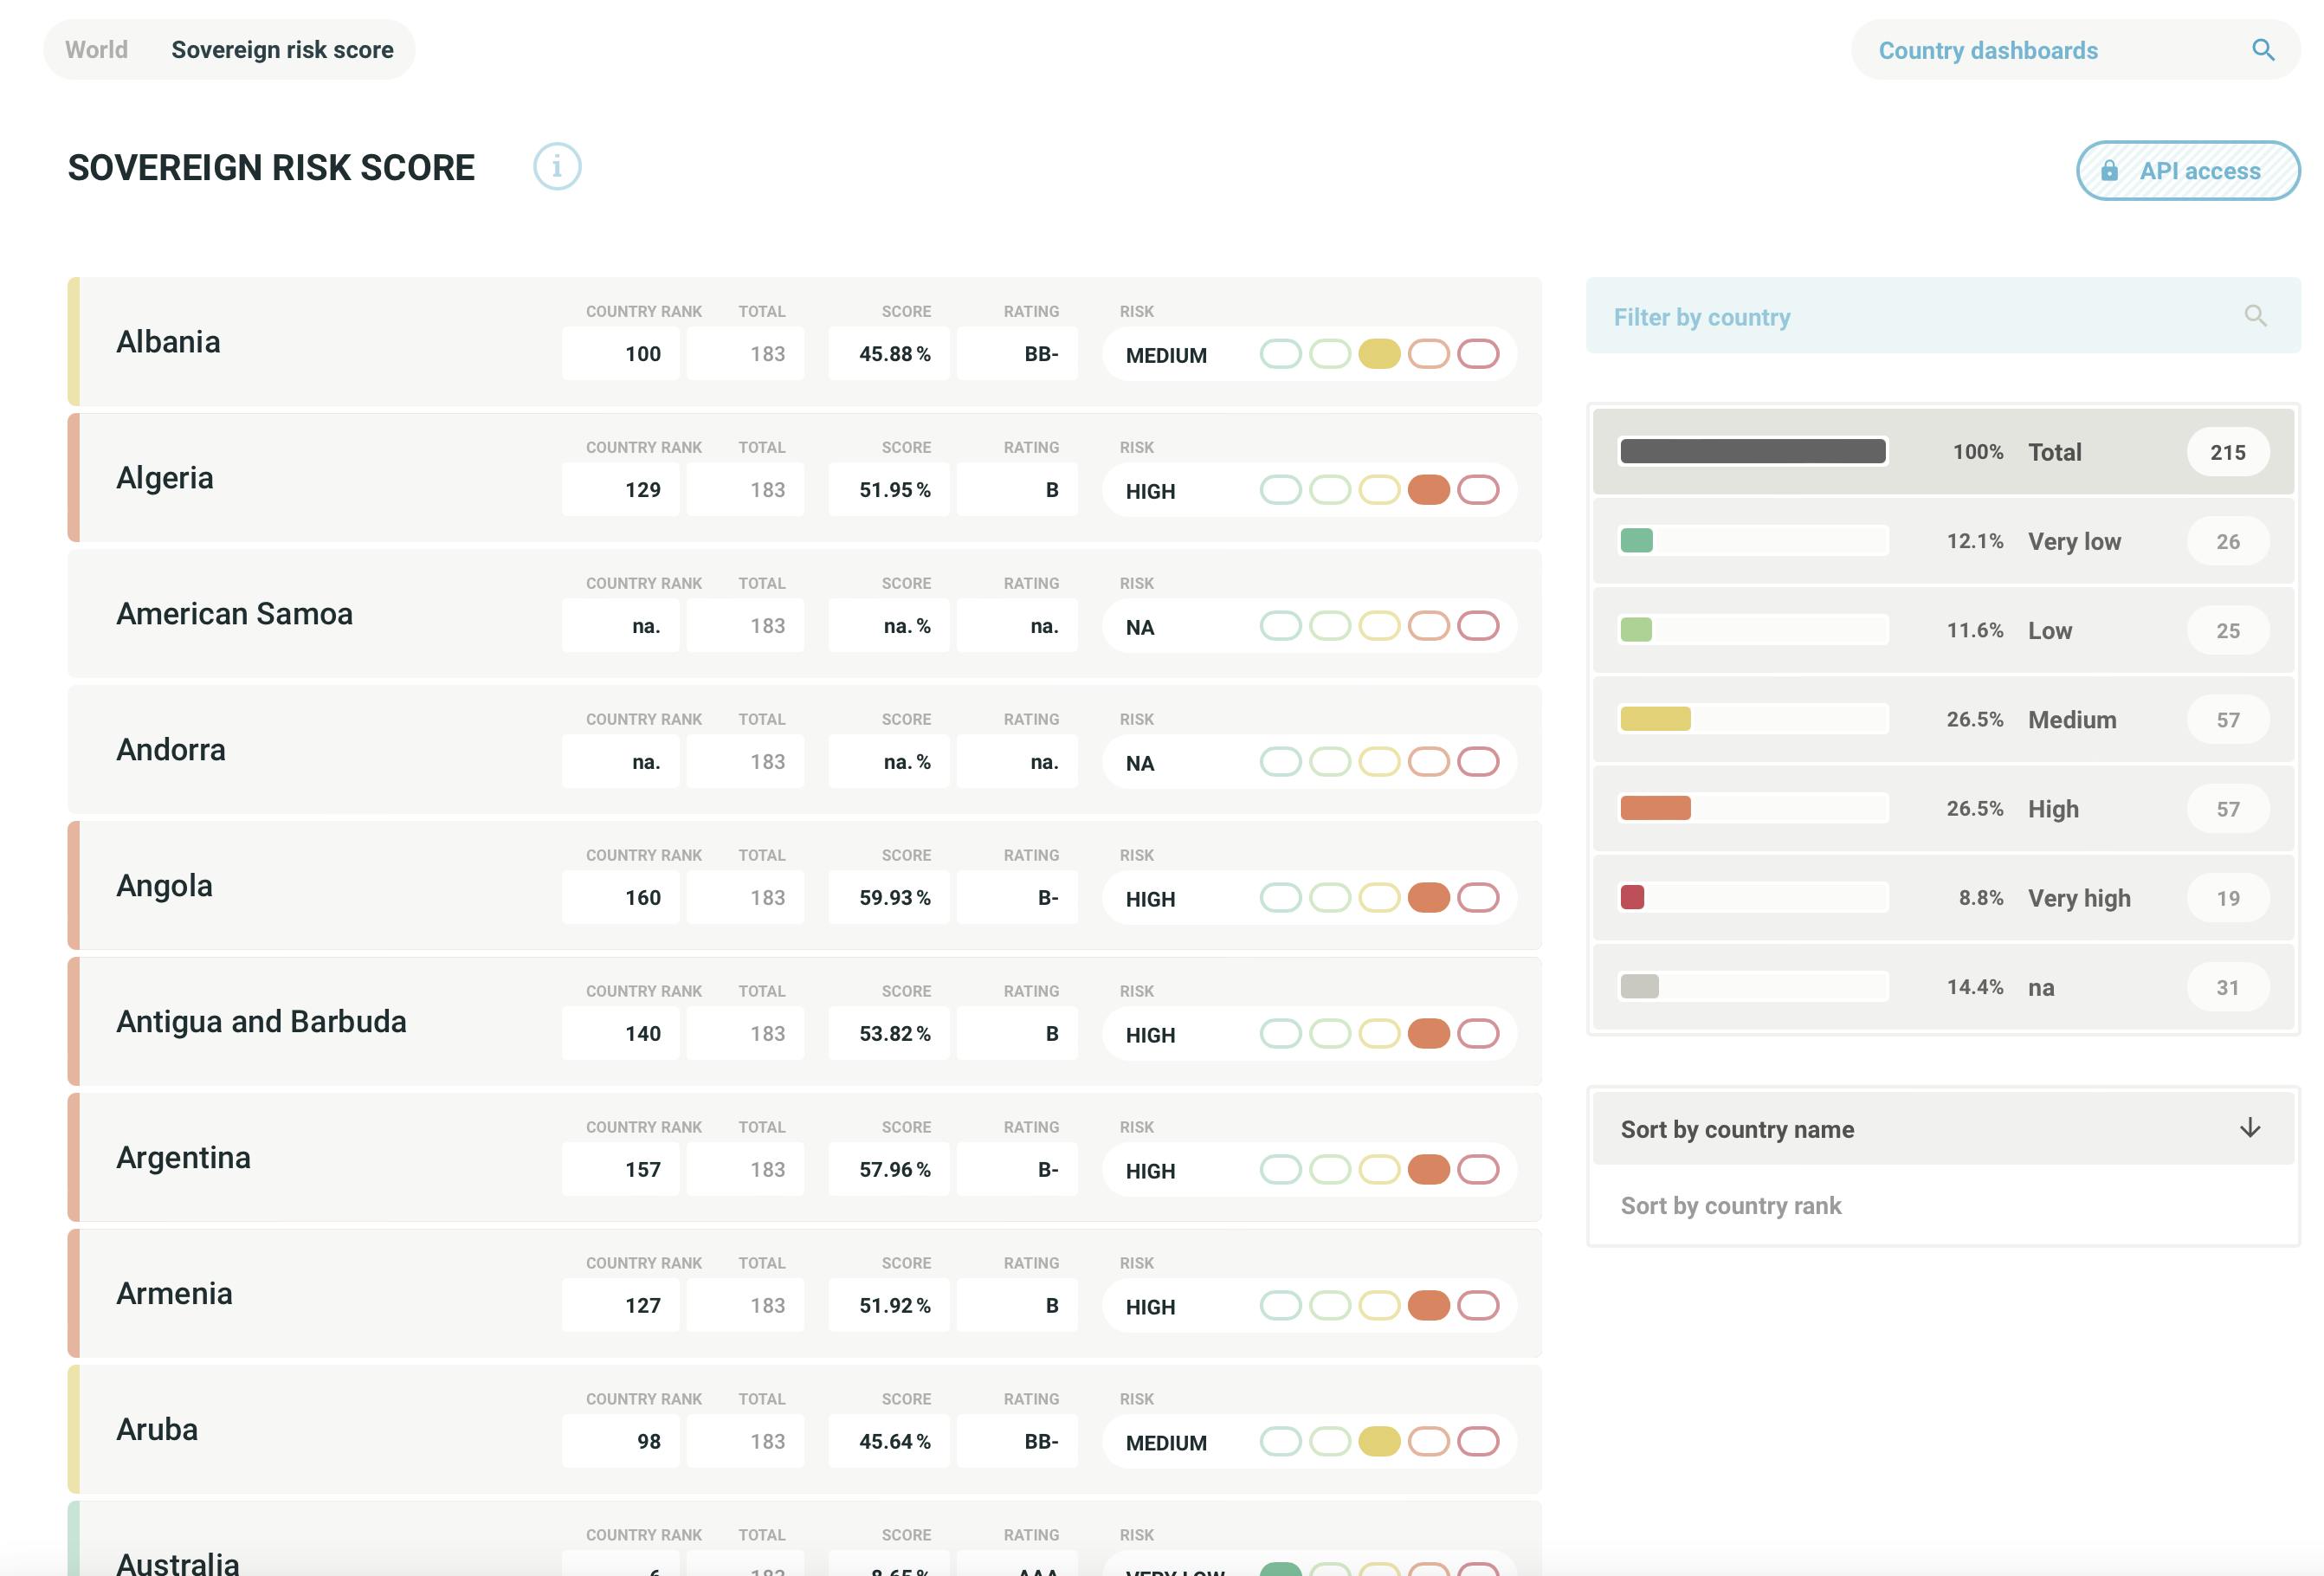
The charts above show Brazil and Norway’s SRSs over time. And the chart below shows the SRSs of several countries as seen in the country dashboard on CountryRisk.io. We invite you to visit the CountryRisk.io Insights Platform to find out more.
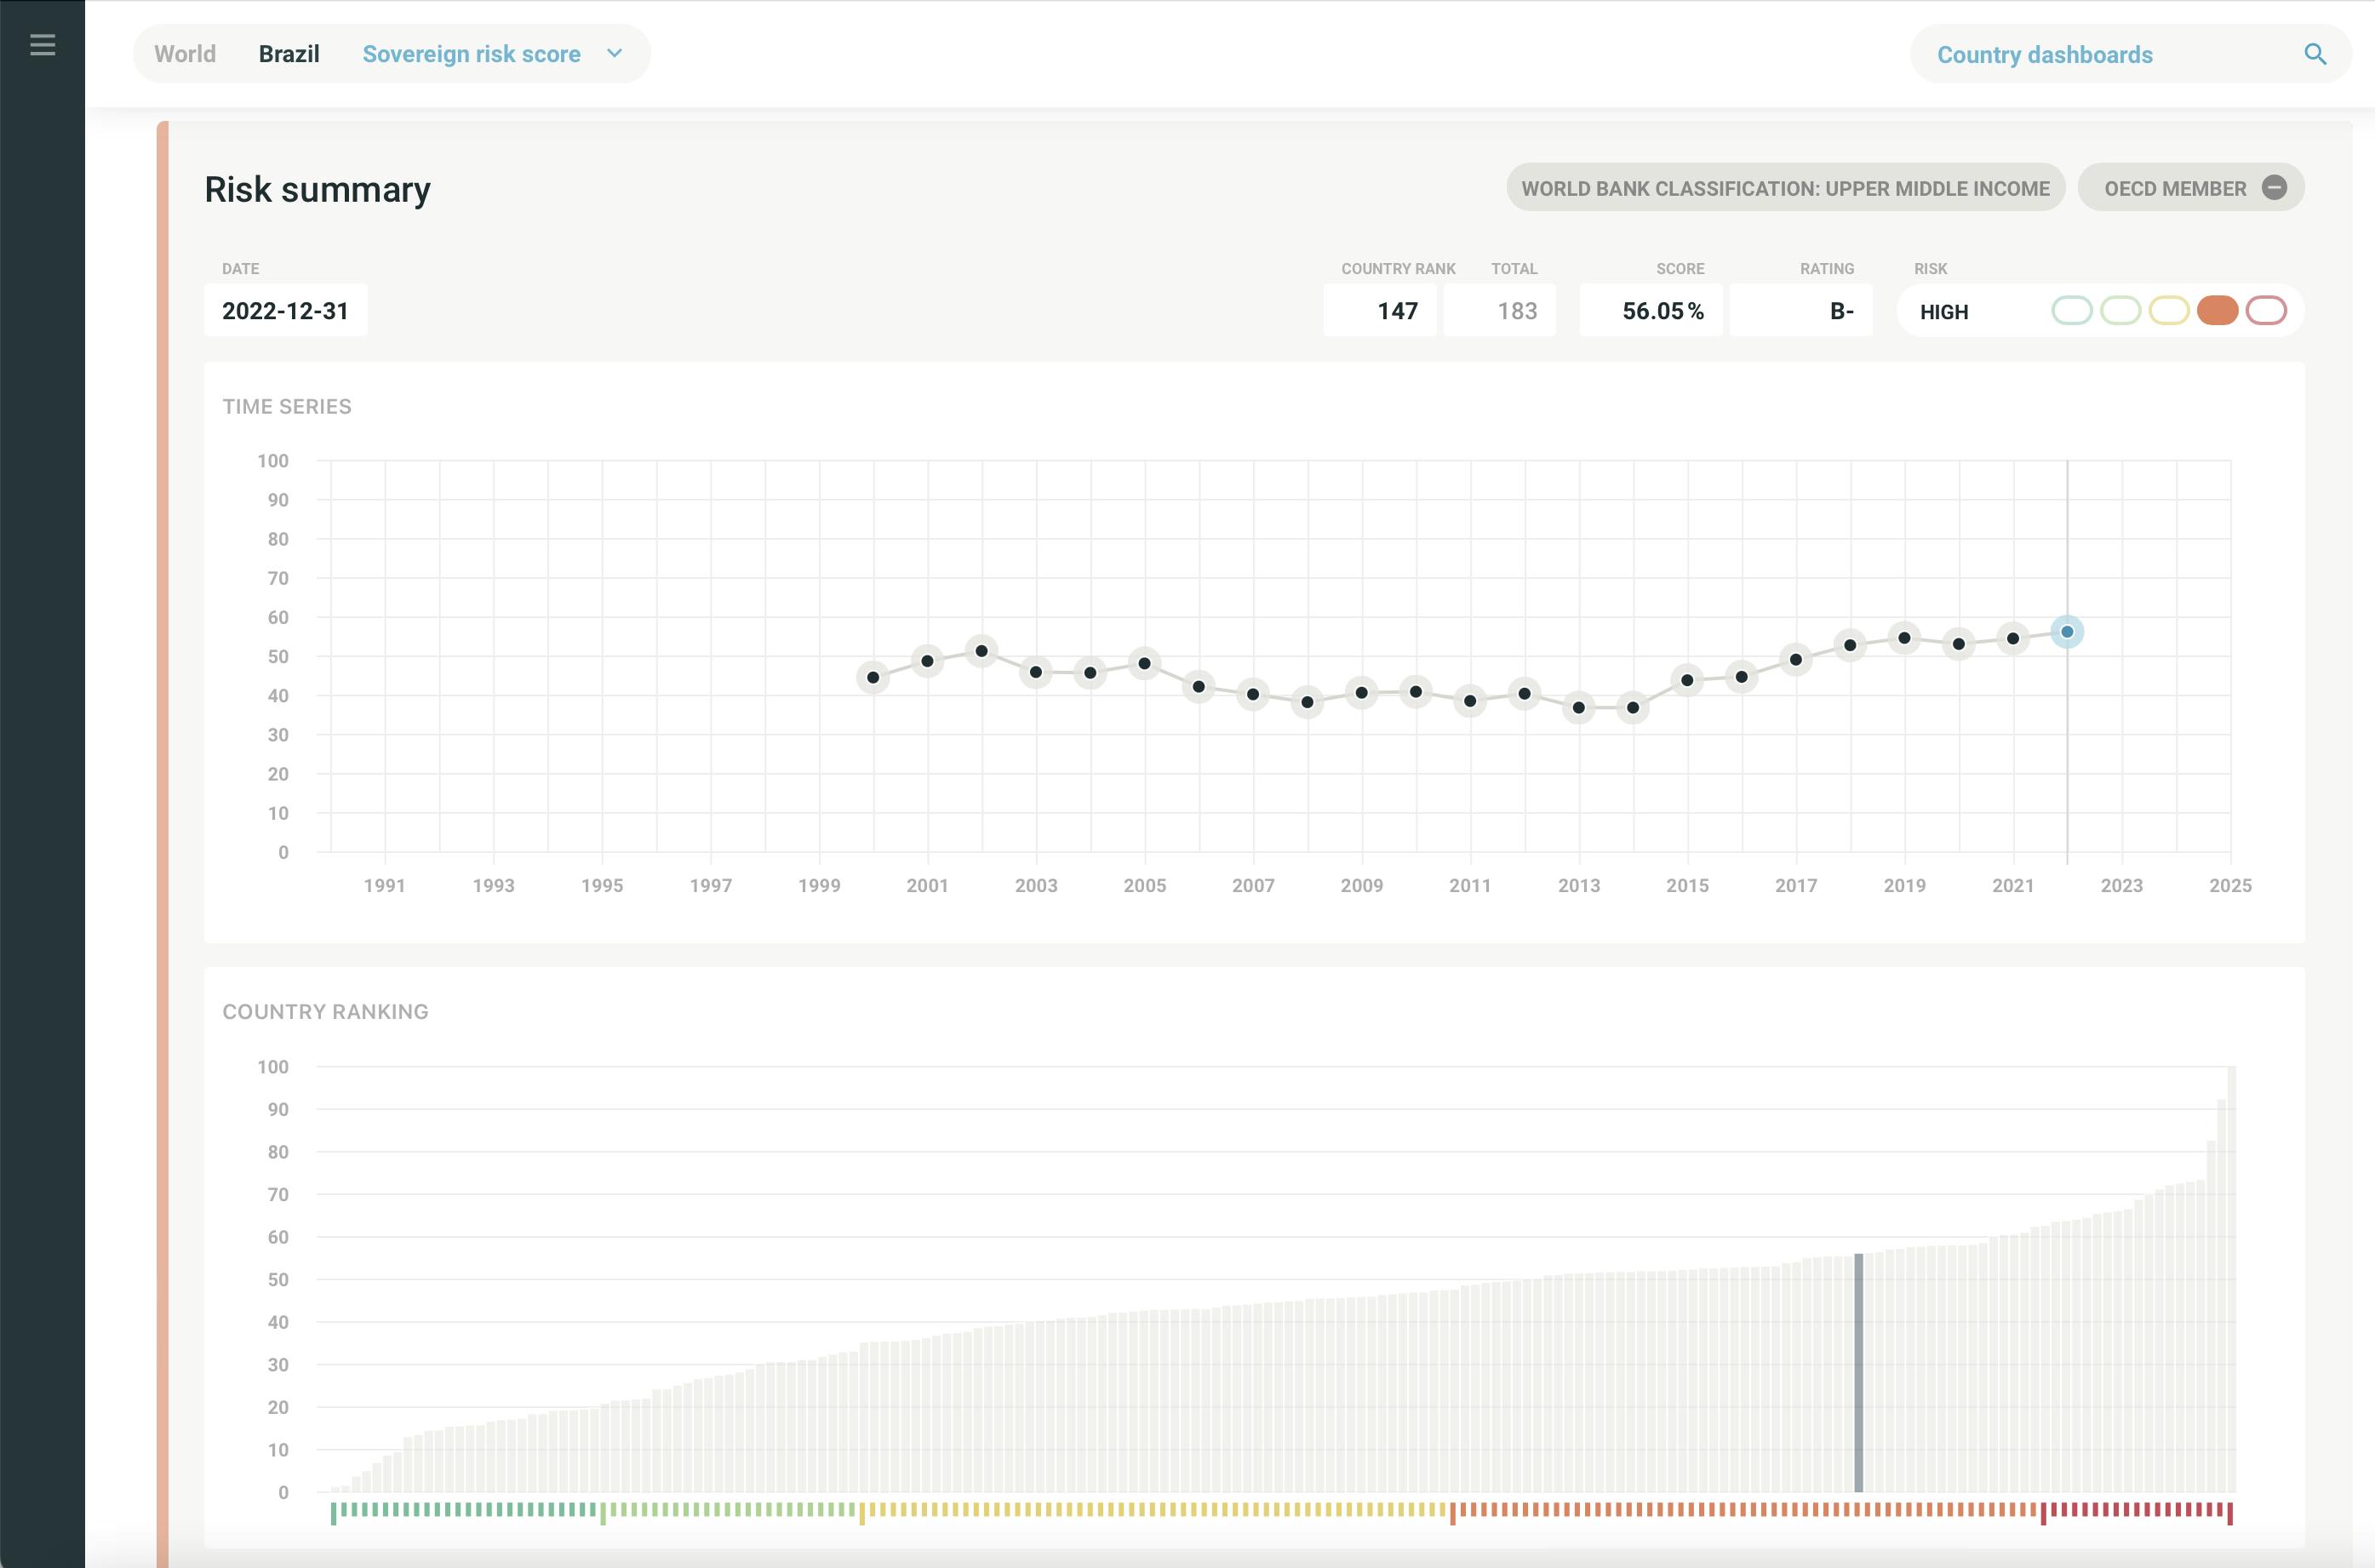
The SRS is a medium-term credit risk measure that shows little change throughout a country’s business cycle. In rating jargon: it’s a through-the-cycle risk measure. Most of the underlying indicators, such as debt-to-GDP ratio or current account balance, are smoothed using a five-year average, which also adds stickiness to the risk score. Since it measures a sovereign’s ability and willingness to honour its foreign currency debt obligations, we’ve mapped all the SRSs to a letter rating to make it easy for you to compare them with agency ratings—such as Fitch, Moody’s, and S&P—or derive shadow credit ratings for unrated sovereigns. You can find all of the matched ratings on the platform.
Applications: Fundamentals-to-spread model
You can use the SRS to track a country’s macroeconomic strengths and vulnerabilities for risk management purposes, or as an input to sovereign bond analyses for investment purposes. Here, though, we’d like to show you how you can use the SRS as input for a fundamentals-to-spread model.
As you may know, we can use this model to distinguish between countries based on whether their fundamentals are under- or over-priced. Or, to put it another way, to find out where in the world you’d be under- and over-compensated for taking macroeconomic investment risks.
We construct a panel dataset that consists of four variables:
Dependent variable:
- Credit Default Swap (CDS) spread (five-year, log). We get this from the World Bank’s Fiscal Space database.
Explanatory variables:
- The SRS, which acts as a proxy for the country’s macroeconomic fundamentals
- The Chicago Board Options Exchange’s (CBOE) Volatility Index (VIX), which acts as a proxy for global risk appetite.
- The Country code ISO3, which acts as a categorical variable
Given the availability of CDS spread data across countries and time—we only use annual data—we have around 5,000observations for the estimation. The SRS and VIX coefficients are highly significant and have the expected sign. And higher SRS or VIX values lead to higher CDS spreads.
The chart below shows the results of Brazil’s fundamentals-to-spread model.
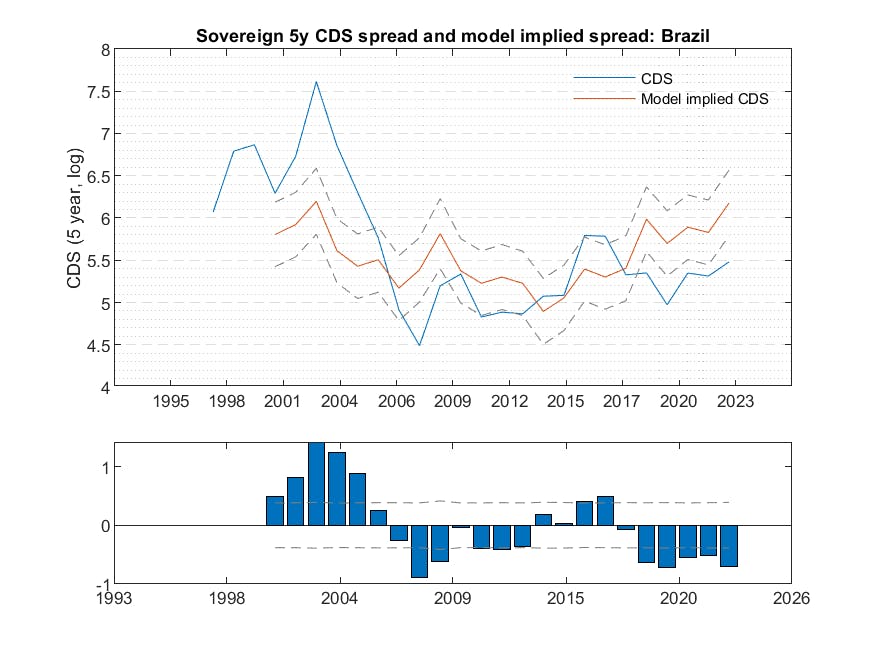
The upper panel shows Brazil’s CDS spread over time, along with the estimated spread based on the SRS, VIX, and country code. The dotted lines show the confidence intervals around the estimation.
The lower panel shows the residuals (i.e. the differences between actual CDS spread and the model-implied spread), with dotted lines representing confidence intervals. Higher residual values suggest that, given the country’s underlying fundamentals, the market is overly pessimistic.
In 2002, credit spreads widened significantly and overshot compared to the underlying fundamentals. Then, on the back of improving macroeconomic data, fair spread levels declined for several years, while the market’s views caught up and converged. But things took another turn in 2007, when the market became overly optimistic and underpriced the fundamental risk.
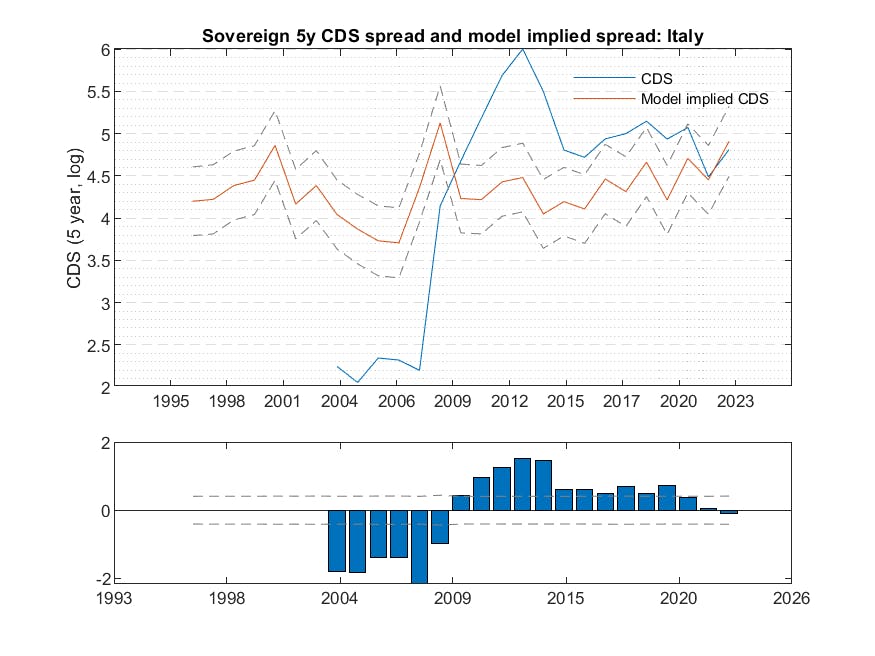
The fundamentals-to-spread model produces similar results for several European countries where credit spreads were out of sync with their fundamentals. You can see the model’s output for Italy below, and the results are very similar for countries like Greece, Spain, and Portugal. Before the financial crises of 2007–2008, credit spreads were artificially low. Market risk aversion towards European sovereigns deteriorated sharply during the European debt crisis, even if fundamentals didn’t change much. In effect, it was akin to a repricing of the overall European idea and its stability. Since then, credit spreads have declined and converged to the fair value, with a slight upward trend as the effects of the COVID-19 pandemic weigh on government credit metrics.
Summary
The CountryRisk.io Sovereign Risk Score is a good measure of a sovereign’s macroeconomic and credit fundamentals. It’s available for a large number of countries, and we update it every month.
Here, we showed you how you can use the SRS in an econometric model to estimate the fair credit spread of sovereigns and as a valuation signal. To devise a sovereign bond investment strategy, we’d complement this model’s valuation signal with some cyclical indicators (e.g., local and global PMI, G3 monetary policies) and a price momentum signal to avoid any value traps.
If you’d like the complete set of fundamentals-to-spread results and model metrics, please get in touch at [email protected].