Methodology
Introduction
This document details the scope and methodology of CountryRisk.io’s updated framework for determining its Sovereign Risk Scores, each of which indicates the level of sovereign credit risk for a given country. Like our Sovereign Rating Model, the scores focus strictly on sovereign governments at a national level, excluding regional governments and quasi-sovereign entities.
Overview
The objective of our Sovereign Risk Scores is to classify countries according to their willingness and ability to honour foreign currency government bond obligations. We convert our risk scores into commonly used letter ratings to facilitate the comparison of our risk scores with the ratings of the Big Three agencies[1]. We do this by using a static convergence table to convert our scores into derived ratings, without applying any qualitative judgment. Contrary to rating agencies we do not declare defaults or distressed restructurings. Our aim is to assess and compare credit fundamentals hence our letter ratings do not contain a default “rating”.
What’s new
The updated CountyRisk.io Sovereign Risk Scores and underlying methodology differ in two significant respects from our previous version.
First, the new version adopts a longer time horizon. As a result, our scores are now less cyclical and volatile than they were previously. We did this by applying multi-year averages to the underlying data.
Second, this version has fewer risk sections and underlying indicators than the previous model. This makes the assessment of a sovereign’s willingness and ability to honour its obligations simpler and more efficient – or simply more parsimonious.
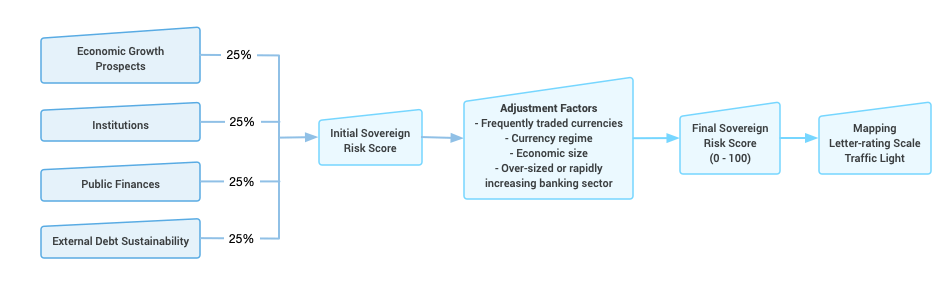
We want our risk scores to emerge from a glass box, not a black one. So, as with the previous version, we determine our Sovereign Risk Scores using exclusively publicly available quantitative indicators. We apply no analytical discretion or qualitative judgement to the model’s output. Figure 1 below shows the overall model structure and lists the individual indicators for each of the four sections.
Risk Sections
We base our Sovereign Risk Scores on four risk determinant sections. These are:
- economic growth prospects and monetary stability,
- institutions and governance,
- public finances, and
- external debt sustainability.
In this updated version of our Sovereign Risk Scores, we augment this analysis with four adjustment factors:
- frequently traded currency,
- size of the economy,
- foreign exchange (FX) regime, and
- size of the banking sector or rapid increase in banking sector assets.
We discuss each of these below.
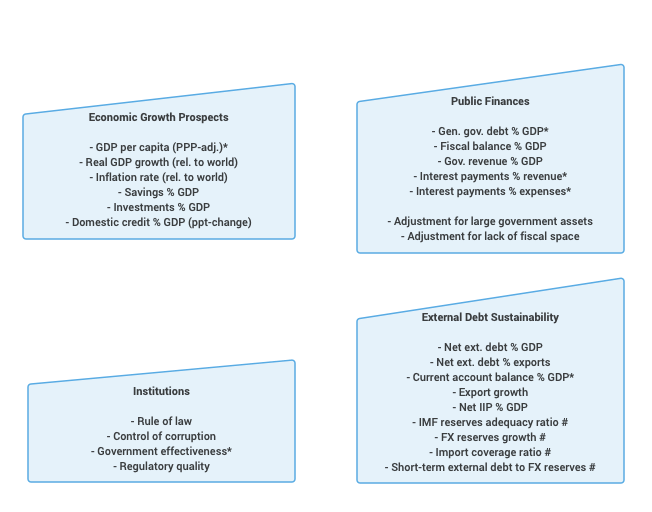
Economic growth prospects and monetary stability
The structure of a country’s economy influences its growth prospects and resilience. In turn, this determines its ability to generate sustainable revenues and service the government’s obligations. A country’s economic structure is, therefore, a key determinant of its risk level.
To assess a country’s economic prospects, we analyse its historical and current growth trends. We also look at its fundamental drivers of long-term growth, such as saving and investment. An economy with a high gross domestic product (GDP) per capita or favourable growth outlook is more likely to provide the government with stable tax revenues in times of financial stress. Higher levels of prosperity also afford its government more flexibility to reduce spending or raise tax revenues without risking the basic subsistence of a large part of the population.
Conversely, a country with limited prospects for increasing the per capita income of its citizens will likely experience persistent revenue shortfalls, prompting the government to borrow regularly—either in its domestic capital markets or abroad—to bridge the inevitable deficits.
Sound monetary policy is a foundation for stable growth and reduces the risk of economic fluctuations during periods of stress. A growing number of central banks in both advanced and emerging economies identify price stability as their primary monetary objective. So, a stable inflationary environment indicates the extent to which central banks achieve their goal. This is important as it minimises risks in related channels—such as the financial sector—as well as its exchange rate.
Institutions and governance
Robust political institutions reduce the risk of crises. They are also supporting an effective and predictable policy response should a financial stress scenario emerge. Strong institutions anchor a country during times of economic instability and mitigate concerns that a government might become unable or unwilling to service its debt. Countries with a robust legal system, established mechanisms for fighting corruption, an effective government, a healthy regulatory regime, and political stability and transparency receive lower risk scores in our framework.
Public finances
The sustainability of a sovereign’s fiscal deficits and government debt is crucial to determining sovereign credit risk. We look at the size of the government’s debt and overall revenues and consider debt affordability in this risk section. Finally, we examine whether the country has sizeable assets (e.g., sovereign wealth funds) that would lead to a corresponding reduction in the risk assessment of the government debt to GDP indicator.
External debt sustainability
CountryRisk.io’s analysis of a country’s external position considers its external liquidity and debt viability. We use several metrics to measure external liquidity, including import coverage, the International Monetary Fund’s (IMF) reserve adequacy ratio (RAR), and short-term debt to foreign exchange (FX) reserves. Import coverage—expressed in numbers of months—depicts the adequacy of foreign exchange reserves to pay for imports and, simultaneously, provides a buffer for any due external debt service payments. Clearly, without enough useable foreign exchange reserves, a country that’s running current account deficits and facing significant payments due in the next twelve months is at higher risk of running into liquidity issues.
We view the net international investment position (NIIP) as a percentage of GDP as a robust indicator of external solvency. Broadly, a negative NIIP leaves a country more vulnerable to the risk of experiencing a long run financial crisis.
Data
In calculating our Sovereign Risk Scores, we use a wide range of indicators selected for their informational value and data availability. We get the data for these indicators from various reputable, international, multilateral institutions (e.g., World Bank, IMF). We also chose the indicators based on other criteria, such as:
- Available history: Is there a long history of regular updates? This allows us to assess whether an indicator is too volatile or prone to structural breaks.
- Reporting lag/latest datapoint: When was the indicator last updated? Will it be updated again in the future?
- Methodology changes: Is the methodology used to calculate the index revised regularly? Frequent and significant changes lead to a lack of comparability over time, while modest changes suggest that the indicator continues to be developed to reflect a changing environment.
- Basis of indicator: Is the indicator based on primary data, or is it a composite of other indicators?
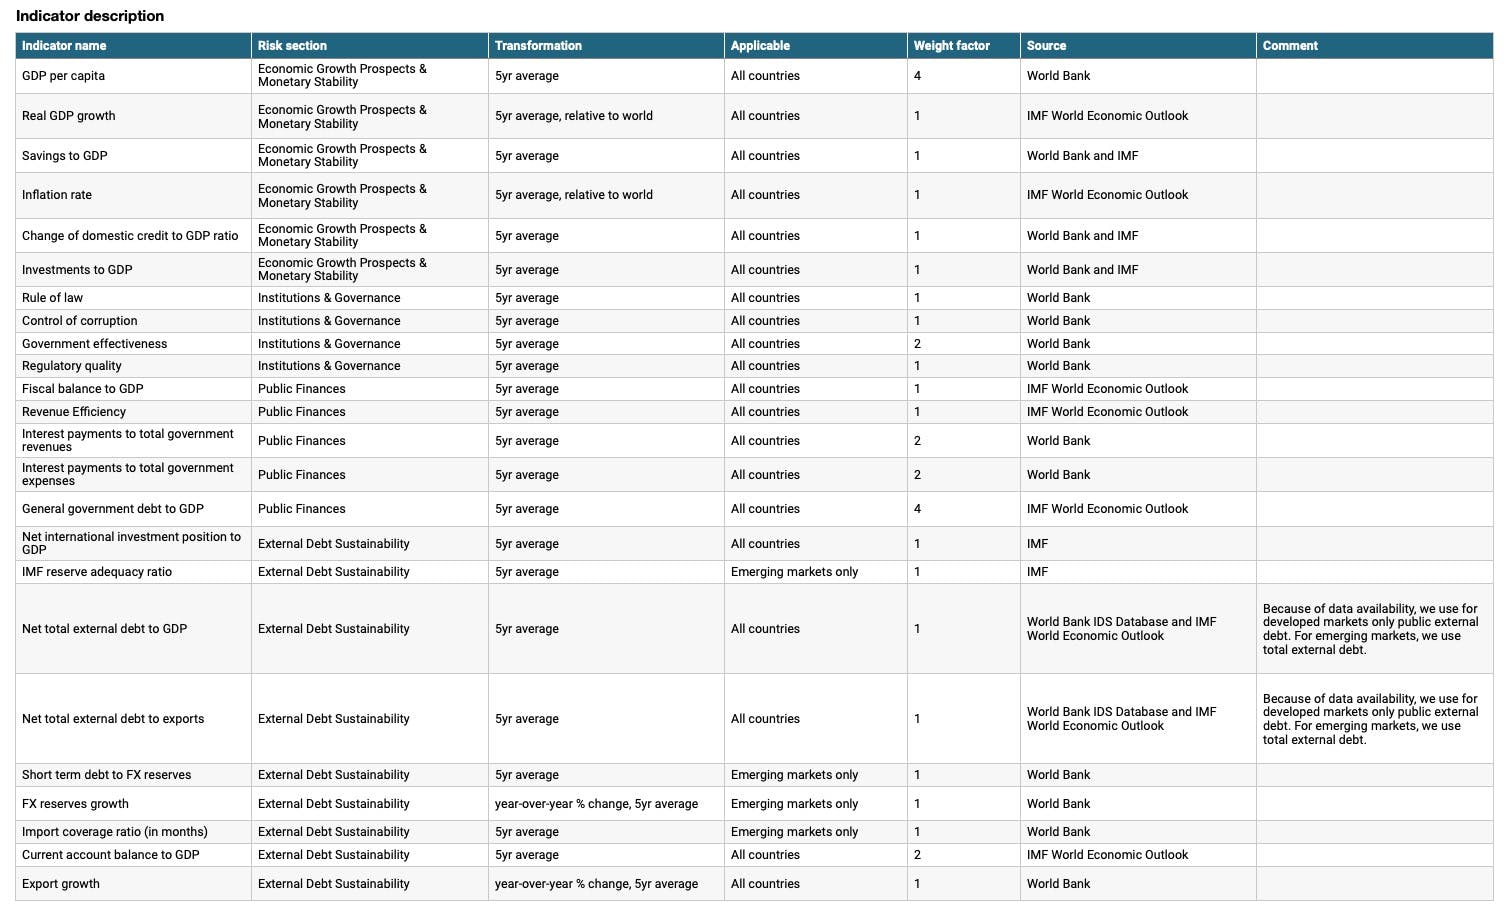
You can find a detailed description of the indicators we use in Appendix I.
The underlying geographic universe covers 190 countries. However, since country coverage varies across indicators, we also provide a quantitative measure of data quality for each country as part of the index calculation. We base this measure on the number of available indicators for each country divided by the total number of indicators included in the model. Below is the mapping table between the share of available indicators and data quality category.
| Share of Available Indicators | < 60% | 60% < 70% | 70% < 80% | 80% < 90% | 90% < 100% |
|---|---|---|---|---|---|
| Data Quality Classification | Very Poor | Poor | Medium | Good | Very Good |
If the data quality category is calculated as ‘very poor’ for a given country and year, we set the risk score result for that category as ‘not available’. In other words, we do not assign a risk score and therefore also no derived rating.
Methodology
CountryRisk.io uses a purely quantitative approach to calculate its Sovereign Risk Scores.
Statistical models use quantitative methods to establish relationships between certain factors—for example, the rule of law—and the strength of debt sustainability in each country. Such models are less prone to bias than purely qualitative methods, which makes them useful in terms of tractability of results and consistency over time. That said, we also understand that statistical models are vulnerable to biases that can influence the process of selecting, specifying, and calibrating the model. Furthermore, some indicators (e.g., institutional quality) reflect the subjective assessments of survey participants, although the usually large number of respondents mitigates the adverse impact of that subjectivity.
Each of the four risk sections in the Sovereign Risk Scores includes several quantitative indicators to yield an initial score for each risk section. We then aggregate the four risk sections to produce an overall risk score, which we finally map to the risk category and letter rating.
The respective weights of each risk section are as follows:
| Risk Section | Section Weight |
|---|---|
| Economic growth prospects and monetary stability | 25% |
| Institutions and governance | 25% |
| Public finances | 25% |
| External debt sustainability | 25% |
Where no underlying indicators are available for a particular risk section, we distribute its weight between the other sections on a pro-rata basis to avoid the associated risk of creating a bias in the overall risk assessment.
Quantitative assessment of indicators
We assess quantitative indicators by assigning values along a risk spectrum ranging from low to high. The risk spectrum is divided into several intervals, and we assign risk points to each interval. For example, higher quality of institutions and governance, such as the rule of law, indicates a greater likelihood that contracts can be enforced through the legal system. Therefore, in our framework, countries with a weaker rule of law receive more risk points than those with a stronger rule of law (see Table 2).
| Rule of Law | 0 < 10 | 10 < 20 | 20 < 30 | 30 < 40 | 40 < 50 | 50 < 60 | 60 < 70 | 70 < 80 | 80 < 90 | 90 < 100 |
|---|---|---|---|---|---|---|---|---|---|---|
| Risk points | 100 | 80 | 70 | 60 | 50 | 40 | 30 | 20 | 10 | 0 |
For instance, where a country has a Rule of Law indicator assessment of 25, we would assign it a score of 70 out of 100 risk points.
Adjustment factors
Following the calculation of the risk section score, we apply adjustment factors that capture certain structural features of a country. These factors don’t typically fluctuate much over time, so they can be interpreted as a level-shift of the overall sovereign risk.
We incorporate the following adjustment factors:
Frequently traded currency
This indicator accounts for the frequency at which a country’s currency is traded in the global foreign exchange markets. The higher the frequency, the more widely used the sovereign’s currency in financial transactions beyond its borders. This suggests that, compared to those whose currencies are traded less frequently, the sovereign is more likely to be able to tap into a wider cross-border base and may be less vulnerable to shifts in investor portfolio preferences. In turn, the international use of such currencies stems from the:
- credibility of the country’s policies and institutions;
- strength of its financial systems;
- size and openness of its capital markets, along with market-determined interest and foreign exchange rates;
- use of its currencies as units of account in global capital markets.
These characteristics will lead to increased demand for the currency and may push the external obligations of sovereigns issuing these currencies to relatively high levels. However, this typically doesn’t present the same degree of risk as it would for countries whose currencies aren’t classified as actively traded. Sovereigns whose currencies are widely traded tend to have more effective and predictable policy settings. This makes it easier for such sovereigns to maintain the confidence of foreign investors.
| Share of traded currencies | <1% | <2% | <5% | <10% | <50% | >50% |
|---|---|---|---|---|---|---|
| Adjustment | 0 | -2 | -3 | -5 | -7 | -10 |
N.B: Due to the bilateral nature of exchange rates, for foreign exchange turnover, the sum of the percentage shares of individual currencies totals 200% instead of 100% because two currencies are involved in each transaction[2].
Size of the economy
Other things being equal, large economies benefit from higher resilience to adverse international shocks than smaller ones, as their sizeable resources and more diverse, dynamic economies absorb external shocks more easily and allow their governments to respond to such shocks more flexibly. Similarly, large economies have more bargaining power in multilateral organisations and forums that affords them a greater ability push through policies in line with their national economic interest. To date, the US and, increasingly, China, have been the main beneficiaries of this adjustment.
| Share of global GDP | <3% | <5% | <10% | <15% | <20% | >20% |
|---|---|---|---|---|---|---|
| Adjustment | 0 | -2 | -3 | -5 | -7 | -10 |
Foreign exchange regime
CountryRisk.io considers countries with flexible exchange regimes to be in a more favourable position than those whose currencies are fixed or pegged to another currency or basket of currencies. This is because, among other things, countries with fixed exchange rates are likely to become more vulnerable to currency crises—as well as to twin currency and banking crises—than those with more flexible regimes. This assumption is confirmed by empirical evidence[3]: fixed exchange rate countries are more likely to require IMF emergency financial assistance than countries with floating currencies. Increased cross-border linkages expose countries with pegged regimes to volatile capital flows. Meanwhile, countries with flexible regimes effectively allow their currencies to adjust instantaneously, which creates a buffer against external shocks.
| Exchange Rate Regime | Adjustment |
|---|---|
| No separate legal tender | 7.5 |
| Currency board | 5.0 |
| Conventional peg or crawling peg/band | 2.5 |
| (Free) floating or independently floating | 0.0 |
Size of the banking sector or rapid increases in banking sector assets
This indicator adjusts for the inherent risk of an over-sized domestic banking sector or one that is rapidly growing. Frequently, a rapid rise in domestic credit can be a harbinger of a credit bubble that, once it bursts, can lead to a drastic deterioration of economic prospects and public finances. This risk is particularly pronounced if the rapid domestic credit expansion is fuelled by external borrowing by the domestic banking sector.
| External Debt Issued by Financial Sector (% GDP) | <50% | <100% | <150% | <200% | <250% | >250% |
|---|---|---|---|---|---|---|
| Adjustment | 0 | 1 | 2 | 3 | 4 | 5 |
| Change of External Debt Issued by Financial Sector (% GDP) | <3%-points | <5%-points | <10%-points | <15%-points | <20%-points | >20%-points |
|---|---|---|---|---|---|---|
| Adjustment | 0 | 1 | 2 | 3 | 4 | 5 |
We agree that it’s impossible to identify the transition objectively and prospectively from a common boom to a dangerous bubble. That said, we do believe that an unusually rapid expansion of financial intermediation warrants the extra caution this adjustment achieves.
Translating total risk points into risk categories
We convert each country’s total risk points as a share of maximum possible risk points into five category ratings ranging from ‘Very Low’ to ‘Very High’ sovereign credit risk. For instance, if the indicator assessments and their respective risk sections yield a total risk score of 40% (out of 100%), we map this score to the risk category of ‘Medium’. Table 3 summarises how we convert total risk points into a risk category. We also visually represent these ratings using a traffic light system with colours ranging from deep red to bright green.
| Risk Points Range | Risk Category | Interpretation |
|---|---|---|
| 0 - 20 | Very Low | Very low risk that the government will not honour its foreign debt obligations. |
| 20 - 35 | Low | Low risk that the government will not honour its foreign debt obligations. |
| 35 - 47.5 | Medium | Some risk that the government will not honour its foreign debt obligations. |
| 47.5 - 62.5 | High | High risk that the government will default on its foreign currency debt obligations in the near future. |
| 62.5 - 100 | Very High | Very high risk that the government will default on its foreign currency debt obligations in the near future. |
It’s important to note that there is no wholly objective way of determining the thresholds for each risk category. By and large, these are subjective decisions that should align with the organisation’s risk appetite. Classifying too many countries as ‘Very High Risk’ would lead to highly restricted business activities, while classifying too many as ‘Very Low Risk’ would lead to un-provisioned risk in the business’s portfolio.
Translating total risk points into letter ratings
We convert each country’s total risk points as a share of maximum possible risk points into the standard sovereign credit ratings ranging from AAA to CCC. The mapping table is shown below.
| Sovereign Risk Score Range | Letter Rating | Risk Level | Interpretation | |
|---|---|---|---|---|
| — | — | D | In Default | The country is currently in default on some or all of its obligations. |
| 75.00 | 100.00 | CC-C | Speculative Grade | Very highly speculative credit quality and high default risk. Default can be avoided only in a favourable economic environment. |
| 70.00 | 74.99 | CCC- | ||
| 65.00 | 69.99 | CCC | ||
| 60.00 | 64.99 | CCC+ | ||
| 55.00 | 59.99 | B- | Speculative Grade | Highly speculative credit quality reflects elevated uncertainty about the country’s ability and willingness to repay its obligations. While current financial obligations are honoured, a deterioration of the economic environment, external account, indebtedness or heightened political uncertainty all have the potential to challenge the country’s capacity to honour its obligations. |
| 50.00 | 54.99 | B | ||
| 47.50 | 49.99 | B+ | ||
| 45.00 | 47.49 | BB- | Speculative Grade | Speculative credit quality reflects uncertainty about the country’s ability and willingness to repay its obligations. Issuer credit risk is vulnerable to unexpected changes. |
| 42.50 | 44.99 | BB | ||
| 40.00 | 42.49 | BB+ | ||
| 37.50 | 39.99 | BBB- | Investment Grade | Good credit quality reflects a low expected credit risk. Unexpected changes in the domestic or global economic environment or structural changes are more likely to impair the credit quality. |
| 35.00 | 37.49 | BBB | ||
| 32.50 | 34.99 | BBB+ | ||
| 30.00 | 32.49 | A- | Investment Grade | High credit quality with capacity and willingness to honour its obligations. That said, credit risk is susceptible to deterioration in the case of unexpected changes of the country’s fundamentals or its economic outlook. |
| 27.50 | 29.99 | A | ||
| 25.00 | 27.49 | A+ | ||
| 20.00 | 24.99 | AA- | Investment Grade | Very high credit quality with ample capacity and proven willingness to honour its obligations. Credit quality is only marginally weaker than the highest credit quality of AAA-rated issuers. |
| 15.00 | 19.99 | AA | ||
| 10.00 | 14.99 | AA+ | ||
| 0.00 | 9.99 | AAA | Investment Grade | Highest credit quality accorded to the greatest capacity and willingness to honour its obligations. Credit quality is unlikely to be weakened by foreseeable events. |
As we apply our methodology, there may be cases where some weaker sovereigns receive scores that correspond with ratings in the CCC category. These scores signify elevated default risk and may prevail for an extended period, as would the corresponding CCC ratings.
In contrast, the common practice of the Big Three rating agencies is to use the CCC rating to signal that a sovereign may—barring some unforeseen positive development—be at imminent risk of default. Such sovereigns then either default or they don’t, and so the average stay in the CCC category at the Big Three is usually short.
At CountryRisk.io, we chose a different approach to counter what we believe to be insufficient granularity at the lower end of the rating spectrum. The most populated rating category at the Big Three agencies is B, where most low-income countries are located—a ‘lumping together’ that provides little differentiation. This is unfortunate because, due to the non-linear nature of ratings, the most significant differences between notches in empirically observed probabilities of default can be found at the lower end of the ratings scale. To avoid this, we use the CCC category not as a ‘waiting room’ ahead of a suspected default, but as a ‘normal’ rating category. This creates more granularity in credit risk assessments precisely where it’s needed most, without affecting comparability across the rest of the scale.
Governance process
Update frequency
We update our Sovereign Risk Index and publish it on the CountryRisk.io Insights Platform towards the end of each month.
Model review and adjustments
CountryRisk.io strives to continuously improve its methodology, such as by incorporating new high-quality indicators as and when they become available.
Footnotes:
* Disclaimer: CountryRisk.io’s assessment of sovereign creditworthiness is derived solely from a statistical model and uses only publicly available data. No qualitative discretion is applied to the model output.
CountryRisk.io is not a regulated entity by ESMA (Link to ESMA). CountryRisk is not a rating agency.
(1) FitchRatings, Moody’s and S&P
(2) Source: Link
(3) Sources: IMF on exchange rate management (Link and Link)
Appendix