Methodology
Introduction
This document details the scope and methodology of CountryRisk.io’s assessment framework for its Supply Chain Country Risk Index.
Overview
Over the last five years, regulatory requirements for in-scope companies to identify and assess risks in their supply chains have increased in many countries. No longer can corporations focus solely on business risks, such as the speed and efficiency with which suppliers process and deliver orders to customers. Increasingly, companies that fail to understand and properly monitor the risks to which they are exposed throughout their supply chains also face serious reputational risk.
The risks involved range from human rights abuses and environmental damage to cyber security threats, money laundering, and financial terrorism. And the requirements don’t just cover direct suppliers and intermediaries. Because final goods generally consist of many parts which are probably sourced from several countries or jurisdictions, it’s equally important to monitor third-party risks. Indeed, the most significant risks tend to occur at the most fundamental levels of the supply chain. Which, more often than not, are also subject to the least oversight.
To perform this kind of due diligence on their supply chains, companies need effective risk management systems. And, in many jurisdictions, they must also implement preventative measures to limit future infractions.
For example, in 2017, France enacted the Loi de Vigilance (Law of Vigilance), which requires businesses to prevent human rights abuses throughout their global supply chains. In Germany, a similar set of rules called Lieferkettengesetz (LkG, Supply Chain Act), is expected to come into force on 1st January 2023. And in the broader European Union, the European Parliament approved a legislative report “on corporate due diligence and corporate accountability” in March 2021. The report recommends the introduction of mandatory corporate supply chain due diligence to identify and prevent human rights abuses and negative environmental impacts.
Of course, there are other good reasons to focus on supply chain risk. Globalisation has transformed trade and financial flows, and respect for human rights and the environment continues to progress. Now, though, national legislation, industry body recommendations, and international enforcement is driving the creation of the tools and processes companies need to monitor risk efficiently and identify erring suppliers.
Our Supply Chain Country Risk Index is an automated tool designed to help companies in their country due diligence, compliance, and governance processes. Individuals can also use the Index to inform their business decisions.
This comprehensive tool captures many different types, sources, and dimensions of supply chain risk. Even so, we understand that a bespoke supply chain risk index may be better for companies that want to apply their own risk definitions, parameters, and weightings. We also recognise that different companies may want to include different indicators, depending on which they see as material. So, we also offer a customised Index solution that empowers companies to tailor their own supply chain risk metrics according to their unique due diligence and governance processes.
Risk Sections
The Supply Chain Country Risk Index focuses on five broad topic areas and ten risk sections. These cover a wide range of relevant environmental, social, governance, and operational risk factors.
| Topic area | Risk section |
|---|---|
| Environment | Climate change & renewable energy Strength of the ecosystem |
| Social | Strength of human rights Access to basic services Equality, diversity and inclusion |
| Governance | Quality of institutions Prevalence of corruption Money laundering |
| Operational risks | Operational risks |
| International treaties and conventions | Ratification of international treaties and conventions |
Environment
To properly assess this multi-faceted topic, ‘Environment’ incorporates two broad perspectives. First, it considers a country’s vulnerability to climate change. And second, it looks at how prepared the country is to meet the challenges that lie ahead.
The costs to consumers and producers because of climate-related supply chain disruptions can be significant. For example, companies that rely heavily on hardware components made in Asia—a region prone to natural disasters—often experience delays in receiving parts or inputs. Time and again, such companies have passed on the added costs to consumers.
However, in recent years, supply chain risk considerations have become more far-reaching and complex. No longer are they confined to “simple” business risks that could create production or delivery delays. Now, companies must increasingly evaluate how such occurrences might affect workers in afflicted areas. In some jurisdictions, they must also prescribe some form of remediation. For example, companies are now required to understand the extent to which workers across their supply chains have reliable access to drinking water. In the past, this was entirely voluntary.
To monitor a country’s vulnerability to climate change, we look at indicators such as CO2 emissions, level of water stress, and the environmental performance index (EPI). Produced by the Yale Center for Environmental Law & Policy, the EPI is a comprehensive scorecard of 180 countries based on 32 performance indicators across 11 material categories.
A country’s ability to take swift action to limit the impacts of natural disasters or environmental changes is the other aspect we consider in this topic. Here, we look at issues such as access to renewable energy, clean fuels, and green technology. Considering such factors enables us to balance a country’s vulnerability to environmental and climate change against mitigating factors so we can deliver a meaningful, forward-looking assessment. We use the ND-GAIN Country Index—developed by Notre Dame Global Adaptation Index—to assess a country’s exposure to climate change and its preparedness to meet the immediate global challenges it faces. INFORM’s Hazard and Exposure Subindex, which reflects the probability of physical exposure associated with specific hazards, is another useful indicator.
Social
Strength of human rights
This section assesses human rights violations and risks in labour environments. People in global supply chains often endure significant human rights abuses, foremost of which is child labour. Many workers are also directly impacted by environmental damages stemming from mining and the industrial production of materials like timber. These human rights violations most often occur at the bottom of the global supply chain. And since, historically, oversight has been neglected in this part of the supply chain, the steps currently being taking to identify and prevent future violations are long overdue.
The 2019 collapse of an iron ore dam in Brumadinho, Brazil killed over 250 workers and unleashed significant quantities of toxic sludge into the surrounding environment. In another disastrous incident, the collapse of the Rana Plaza building in Dhaka, Bangladesh, killed 1,132 people and injured around 2,500 more across its five garment factories and other establishments. Companies connected to such incidents immediately find themselves in the spotlight, sustaining significant reputational damage when they’re found to have failed to ensure workers’ safety and security.
In assessing human rights violations in the global supply chain, we look at several material indicators. These include the Fund for Peace’s Human Rights Index (which is a component of its Fragile States Index), the Walk Free Foundation’s Global Slavery Index, and a number of sub-indexes in UNICEF’s Children Rights in the Workplace Index.
Access to basic services
Closely related to ‘Strength of human rights’, ‘Access to basic services’ focuses on the social foundations workers need to do their jobs, along with their working environments. We assess this section using a wide range of indicators from the United Nations and its agency, the World Health Organization, as well as the World Bank.
A quality education equips people to work in every sector of the economy. In gauging access to education, we look at primary (net), secondary (net), and tertiary (gross) education enrolment ratios.
Equally important is the delivery of facilities that fulfil fundamental human needs, such as effective sanitation services. We also look at immunisation against commonly transmitted diseases such as measles, hepatitis, and diphtheria, and hospital bed availability.
Finally, no assessment of access to basic services is complete without considering the availability of social safety net programmes like unemployment benefits.
Equality, diversity, and inclusion
In many workplaces, equality, diversity, and inclusion are now familiar concepts. Now, though, they’re becoming more entrenched throughout supply chains, including at its most fundamental levels.
Equality is about ensuring fair access to opportunities across the labour force. It means that everyone, irrespective of their background, should be able to apply for any position, be considered based only on their relevant abilities, and have the chance to progress. Delivering equality requires the removal of barriers to participation for certain groups that are often marginalised.
Diversity refers to employing people regardless of their age, gender, race, religion, ethnicity, and sexual orientation. Inclusion is about fostering a supportive, respectful working environment that accepts people’s differences. Delivering equality, diversity, and inclusion brings significant benefits to organisations by growing their talent pools, skillsets, ideas, and innovation.
Governance
Quality of institutions
A productive market economy requires a well-defined system of rules, regulatory frameworks, and property rights that underpin the operational environment and mitigate risks. The rule of law fosters accountability in people, businesses, public entities, and governments. However, a framework is only as good as its implementation. So, a country with strong rule of law and enforcement is one that has (i) clear separation of powers between the legislative, judicial, and executive branches; and (ii) laws and regulations that are predictable and promote fair, efficient activities between parties.
Prevalence of corruption
A key factor in determining the likelihood of money laundering in a country is the prevalence of corruption in different segments of its economy (e.g., private or public sector entities). High levels of corruption lead to an erosion of trust in the system and institutions, inefficient resource allocation, higher wealth inequality, and a lack of incentives for innovation. High incidences of bribery in the public and private sectors also correlate with an increased risk of money laundering. This is also true of legal corruption, in which powerful private sector entities or individuals influence the shaping of laws to protect their interests.
Money laundering
Transparency is essential to the prevention of illicit activities and money laundering. In the latter context, transparency refers to the quality and depth of disclosure of ownership and financial information by private sector companies, and of how governments and other public sector entities allocate funds.
Operational risk
A resilient supply chain is characterised by its resilience and capacity to recover. Operational risks are everywhere. A supplier’s macroeconomic environment could suffer an exogenous shock that impacts the country’s growth and inflation outlooks, raising prices and laying workers off. For example, a company that is heavily reliant on a particular country for a precious commodity may experience considerable disruption and losses should the nation suffer a natural disaster or attack.
In assessing supply chain country risk, we also look at a country’s overall level of operational risk. This refers to the risk of doing business in a country, including how easy it is for organisations to repatriate capital if they need to.
Economic sanctions are a vital policy tool that governments and international organisations use to fight illegal activities such as money laundering, the financing of terrorism, and human rights violations. Sanctions can be targeted at an entire country (also known as comprehensive sanctions), or at legal entities or groups of individuals (also known as targeted sanctions).
Treaties & Conventions
Treaties and conventions are foundational to government initiatives—particularly in Europe—in mapping out their respective supply chain acts or regulations. Germany’s LkG, for example, explicitly incorporates three conventions on environmental issues. These are: (i) the Stockholm Convention on Persistent Organic Pollutants (POP), (ii) the Minamata Convention, and (3) the Basel Convention. Each of these conventions is designed to prevent the use of persistent organic pollutants, reduce mercury emissions, and rein in the movement of hazardous waste across borders.
CountryRisk.io takes all of these into account, as well as International Labour Organisation (ILO) and UN conventions on labour laws that place minimum standards on working conditions in organisations throughout the supply chain, including those at the most fundamental level.
Data
To calculate the Supply Chain Country Risk Index, we selected 85 indicators for their informational value and data availability. We source data from a wide range of reputable international multilateral institutions, including the United Nations, World Bank, and the World Justice Project. We also source data from special interest organisations that focus on relevant subjects, such as the Basel Convention, the Stockholm Convention, and the Financial Action Task Force (FATF). For a full list of indicators, refer to the file here (link).
Country coverage
The underlying geographic universe covers 250 countries and territories. However, different indicators have different levels of country coverage, and some have significant data gaps. That said, accounting for the size of each country’s economy (i.e., contribution to global GDP), most indicators cover 95% of the global economy.
Besides country coverage, we selected the indicators on the basis of other criteria, such as:
- Available history: Is there a long history of regular updates? This allows us to assess whether an indicator is too volatile.
- Reporting lag/latest datapoint: When was the index last updated? Will it be updated again in the future?
- Methodology changes: Is the methodology used for calculating the index revised regularly? Frequent and significant changes lead to a lack of comparability over time, while modest changes suggest that the indicator continues to be developed to reflect a changing environment.
- Basis of indicator: Is the indicator based on original (survey) data, or is it a composite of other indicators?
As part of the index calculation, we also provide a quantitative Data Quality measure for each country. We base this measure on the number of available indicators for that country divided by the total number of indicators included in the model. The mapping table between the share of available indicators and data quality is shown below.
| Share of Available Indicators | < 50% | 60% < 70% | 70% < 80% | 80% < 90% | 90% < 100% |
|---|---|---|---|---|---|
| Data Quality Classification | Very Poor | Poor | Medium | Good | Very Good |
Countries with less than 30% of available indicators automatically receive the risk category “Not Available”.
For the model specification, it was important to select indicators that a) measure factors relevant to supply chain risk; and b) have an informational value that’s comparable to the other indicators we selected. Unsurprisingly, then, the indicators show a relatively high mutual correlation.
Methodology
CountryRisk.io uses a purely quantitative approach to measuring country supply chain risk.
Statistical models use quantitative methods to establish relationships between certain factors—for example, the rule of law—and the strength of information security in each country. Such models are less prone to bias than purely qualitative methods. And this makes them useful in terms of tractability of results and consistency over time. However, statistical models are still vulnerable to biases that can influence the selection, specification, and calibration of the model. Also, several of the underlying indicators reflect the subjective assessments of survey participants, although the large number of respondents significantly reduces the impact of that subjectivity.
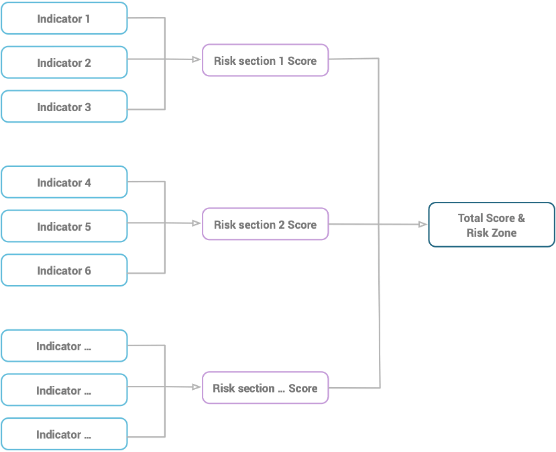
The Supply Chain Country Risk Index uses ten risk sections to derive each country’s overall risk score. Each risk section includes several quantitative indicator assessments, which we weight equally. These assessments provide the ten risk section scores, which we weight to reflect their relative importance to supply chain risk. We then aggregate the ten risk section scores to produce an overall risk score, which we then map to the appropriate risk zone classification.
Figure 1 shows a schematic of this process.
The respective weights of each risk section are as follows:
| Risk Section | Section Weight |
|---|---|
| Environment: Climate change & renewable energy | 12.5% |
| Environment: Strength of the ecosystem | 10.0% |
| Social: Strength of human rights | 7.5% |
| Social: Equality, diversity, and inclusion | 7.5% |
| Governance: Quality of institutions | 7.5% |
| Governance: Prevalence of corruption | 7.5% |
| Governance: Money laundering | 7.5% |
| Operational risks | 22.5% |
| Ratification of treaties and conventions | 10.0% |
If there are no underlying indicators available for a particular risk section, that section’s weight is distributed between the risk sections where underlying data is available on a pro rata basis. This reduces the risk of creating a downward bias in the overall risk assessment. The table below shows an example in which we’ve assumed that no data is available for the ‘Prevalence of corruption’ risk section. Here, this section’s 7.5% weighing is proportionately redistributed among the other risk sections. This includes, for instance, the ‘Climate change & renewable energy’ risk section, whose weight increases from 12.5% to 13.51%.
| Risk section | Section weight | Data available | Adjusted risk section weight |
|---|---|---|---|
| Environment: Climate change & renewable energy | 12.50% | Yes | 13.51% |
| Environment: Strength of the ecosystem | 10.00% | Yes | 10.81% |
| Social: Strength of human rights | 7.50% | Yes | 8.11% |
| Social: Equality, diversity, and inclusion | 7.5%0 | Yes | 8.11% |
| Governance: Quality of institutions | 7.50% | Yes | 8.11% |
| Governance: Prevalence of corruption | 7.50% | No | NA |
| Governance: Money laundering | 7.50% | Yes | 8.11% |
| Operational risks | 22.50% | Yes | 24.32% |
| Ratification of treaties and conventions | 10.00% | Yes | 10.81% |
Quantitative assessment of indicators
We assess quantitative indicators by assigning them values along a risk spectrum that ranges from low to high. We divide this risk spectrum into several intervals, with risk points assigned to each interval. For example, a higher quality of institutions and governance, such as rule of law, indicates a greater likelihood that contracts can be enforced through the legal system. So, in our framework, countries with a weaker rule of law receive more risk points than those with a stronger rule of law (see Table 5). A country with a Rule of Law indicator rating of 25, for instance, is scored 100 out of 100 risk points.
| Rule of Law | 0 < 40 | 40 < 50 | 50 < 60 | 60 < 70 | 70 < 80 | 80 < 100 |
|---|---|---|---|---|---|---|
| Risk points | 100 | 80 | 60 | 40 | 20 | 0 |
Similarly, we assign risk points to the detailed FATF assessments where they are related to the level of compliance or effectiveness in specific areas.
| FATF Technical Assessment | Compliant | Largely Compliant | Partially Compliant | Non Compliant | Not Available |
|---|---|---|---|---|---|
| Risk points | 0 | 25 | 50 | 100 | 100 |
For example, if a country is rated as ‘Largely compliant’ for the ‘Transparency and beneficial ownership of legal persons’ sub-index, we assign 25 out of a maximum of 100 risk points to that country (see Table 6 above). The overall score for the FATF technical assessment indicator is the average of the risk scores for each of its sub-indices. We apply the same methodology to other similar indicators, such as the Trafficking in Persons ratings and INCRS listings.
Translating total risk points into risk categories
We convert each country’s total risk points as a share of maximum possible risk points into one of five supply chain risk category ratings, ranging from ‘Very Low’ to ‘Very High’. We also visually represent these ratings using a traffic light system, with colours ranging from deep red to green.
For instance, if the 85 indicator assessments and their respective risk sections yield a total risk score of 40% (out of 100%), we map this score to the risk category of ‘Medium’. Table 7 summarises how we convert total risk points into a risk category.
It's important to note that there’s no wholly objective way to determine the thresholds for each risk category. By and large, these are subjective decisions that should align with the organisation’s risk appetite. Classifying too many countries as ‘Very High Risk’ would lead to very restrictive business activities. And classifying too many as 'Very Low Risk’ would lead to un-provisioned risk in the business portfolio.
| Risk Points Range | Risk Category | Interpretation |
|---|---|---|
| 0 < 15 | Very Low | Very low risk of doing business with a supplier in the country. Robust regulatory framework, very strong institutions, low levels of corruption, strong environmental and social standards, excellent implementation of best practices and industry body guidelines. |
| 15 < 30 | Low | Low risk of doing business with a supplier in the country. Some shortcomings in terms of ESG standards. |
| 30 < 45 | Medium | Medium risks associated with the country across the various risk sections. |
| 45 < 60 | High | High risk of doing business with a supplier in the country. Prevalent corruption in the private and public sectors, weak institutions, and lack of ESG standards. |
| 60 - 100 | Very High | Very high risk of doing business with a supplier in the country due to the lack of quality institutions, governance, and ESG standards. |
Where less than 30% of all indicators are available, we classify the country as “Not available”.
Jurisdictional mapping
For certain jurisdictions, we derive the Supply Chain Country Risk Score from the result of a related country or jurisdiction. This is typically the case for small islands. For example, Åland Island receives the same Supply Chain Risk Score and classification as Finland. The full list of such cases is shown below:
| Jurisdiction... | ... mapped to |
|---|---|
| Aland Island | Finland |
| Bonaire, Sint Eustatius and Saba | Netherlands |
| Bouvet Island | Norway |
| British Indian Ocean Territory | United Kingdom |
| Christmas Island | Australia |
| Cocos (Keeling) Islands | Australia |
| Falkland Islands (Malvinas) | United Kingdom |
| Faroe Islands | Denmark |
| French Polynesia | France |
| French Southern and Antarctic Lands | France |
| Guadeloupe | France |
| Heard Island and McDonald Islands | Australia |
| Mayotte | France |
| New Caledonia | France |
| Niue | New Zealand |
| Norfolk Island | Australia |
| Northern Mariana Islands | USA |
| Pitcairn Islands | United Kingdom |
| Saint Barthélemy | France |
| Saint Helena, Ascension and Tristan da Cunha | United Kingdom |
| Saint Martin (French region) | France |
| Saint Pierre and Miquelon | France |
| South Georgia and the South Sandwich Islands | United Kingdom |
| Svalbard and Jan Mayen | Norway |
| Tokelau | New Zealand |
| United States Minor Outlying Islands | USA |
| Wallis and Futuna | France |
Guidance for overruling
When conducting supply chain country risk assessments, you may want to overrule and adjust our quantitative risk classifications for various reasons that lie outside the scope and control of CountryRisk.io. Such reasons might include:
- Close to threshold: If the CountryRisk.io Supply Chain Country Risk Score is close to the threshold values for a risk category (e.g., ‘High Risk’), you might decide to overrule and adjust the final risk category.
- Country-specific developments not yet reflected in data: In the case of a sharply deteriorating domestic environment, you might decide to overrule the risk zone classification if this isn’t yet reflected in the underlying data we used to calculate the index. Evidence of such a deterioration might include, for instance, news of a significant money laundering incident in a specific country.
- Business reasons: A business might decide to override a supply chain risk category for commercial reasons specific to that business.
Governance process
- Update frequency: We update the Supply Chain Country Risk Index every month and make it available through the CountryRisk.io Insights Platform towards the end of each month. We also update the data on an ad hoc basis if substantial new information becomes available.
- Model review and adjustments: CountryRisk.io strives to continuously improve its methodology, such as by incorporating new high-quality indicators as and when they become available. CountryRisk.io also consults external experts to review the model and any adjustments we make to it. We will reflect any changes in future versions of this methodology document.