Methodology
Introduction
This document details the scope and methodology of CountryRisk.io’s framework for determining its ESG Sovereign Risk Scores. These scores denote the indicative level of sovereign credit risk for each country based on twelve risk determinant sections. These are: (1) economic growth prospects, (2) institutions and governance, (3) monetary stability, (4) fiscal solvency and public debt, (5) sovereign liquidity, (6) external debt sustainability, (7) private sector strength, (8) climate change and renewable energy, (9) biodiversity, (10) education, (11) heath, food insecurity and poverty and (12) labour market, social safety nets and equality.
Overview
The objective of the CountryRisk.io ESG Sovereign Risk Scores is to classify countries according to their willingness and ability to honour foreign currency government bond obligations whilst taking into account explicitly environmental and social indicators. The scores are largely derived from CountryRisk.io’s ESG sovereign rating model; however, they do not take into account the qualitative indicators that appear in that model. This is explained in more detail in the ESG Sovereign Rating Methodology. Simply put, the Sovereign Risk Scores only consider quantitative indicators. Table 1 lists the individual indicators for each of the seven sections.
| Risk Section | Indicators |
|---|---|
| Economic growth prospects | GDP per capita Real GDP growth (5 year average) Real GDP volatility (5 year window) Gross national savings (% GDP) Trade openness Research and development expenditures (% GDP) Researchers in R&D (per million people) Unemployment rate Youth unemployment rate Labour force participation rate |
| Institutions and governance | Rule of law Control of corruption Government effectiveness Regulatory quality Voice and accountability Political stability Level of statistical quality |
| Monetary stability | Inflation rate (5 year average) Inflation volatility (5 year window) Change of domestic credit to GDP ratio (5 year window) Real interest rate |
| Fiscal solvency and public debt | General government debt to GDP Public external debt to GDP Public external debt to total external debt Revenue efficiency |
| Sovereign liquidity | Fiscal balance (% of GDP) Current account balance (% of GDP) Export growth (5 year average) Interest payments to tax revenues Debt service (% of exports) |
| External debt sustainability | Net external debt (% of GDP) Net external debt (% of exports) Short-term external debt to FX reserves Import coverage (in months) External financing requirements IMF reserves adequacy ratio Short-term external debt to total external debt Foreign currency denominated external debt to total external debt |
| Private sector strength | Non-performing loans to total loans Regulatory capital to risk-weighted assets Return on equity Liquid assets to short-term liabilities Household debt to GDP |
| Climate change and renewable energy | CO2 emissions Renewable energy consumption Renewable electricity output Access to clean fuels and technologies for cooking Emissions of carbon dioxide per unit of GDP ND-GAIN Index ND-GAIN Vulnerability Index |
| Biodiversity | Protected areas Air pollution Deforestation |
| Education | Completion rates Attainment rates Enrolment ratios Pupil-to-teacher ratios Literacy rates |
| Health, food insecurity and poverty | INFORM Risk Index Lack of coping capacity index Life expectancy Net migration Quality of health care system Intentional homicides Mortality rates Immunisation rates Public health expenditures Poverty ratio Access to sanitation services |
| Labour market, social safety nets and equality | Income equality Unemployment rates Proportion of seats held by women in parliament Individuals using the internet Account ownership at a financial institution Age dependency rate Proportion of unemployed receiving beneftis Coverage of social safety programs Unsentenced detainees as a proportion of overall prision population |
Like CountryRisk.io’s ESG sovereign rating model, our ESG Sovereign Risk Scores focus strictly on sovereign governments at a national level, excluding regional governments and quasi-sovereign entities.
Risk Sections
Economic growth prospects
The structure of a country’s economy influences its growth prospects and resilience. In turn, this determines its ability to generate sustainable revenues and service the government’s obligations. A country’s economic structure is, therefore, a key determinant of its risk level.
To assess a country’s economic prospects, we analyse its historical and current growth trends. We also look at its fundamental drivers of long-term growth, such as human capital (e.g. research and development expenditure), integration with the global economy and labour market aspects (e.g. unemployment rate, labour force participation rate). An economy with a high gross domestic product (GDP) per capita or favourable growth outlook is more likely to provide the government with stable tax revenues. Conversely, a country with limited prospects for increasing the per capita income of its citizens will likely experience persistent revenue shortfalls and, therefore, need to borrow regularly—either in its domestic capital markets or abroad—to bridge the inevitable deficits.
Institutions and governance
Robust political institutions serve to anchor a country during times of economic instability and mitigate concerns that a government might not service its debt. Countries with a robust legal system, established mechanisms for fighting corruption, an effective government, a healthy regulatory regime and political stability and transparency receive lower risk scores in our framework. In addition, this risk section includes an indicator that assesses the overall ease of doing business within that country.
Monetary stability
Sound monetary policy is a foundation for stable growth and reduces the risk of economic fluctuations during periods of stress. This indicator assesses monetary authorities’ success in using the tools at their disposal flexibly and independently, without interference from governments whose goals may not align with those of the central bank.
A growing number of central banks in both advanced and emerging economies identify price stability as their primary monetary objective. So, a stable inflationary environment indicates the the extent to which central banks have the ability to achieve that goal. This is important as it minimises risks in related channels, such as the banking and financial sector as well as its currency exchange rate.
Fiscal solvency and public debt
The sustainability of a sovereign’s fiscal deficits and debt is crucial to determining sovereign credit risk. In assessing the former, CountryRisk.io looks at the size of the government’s revenues and debt.
Sovereign liquidity
Whereas our assessment of “fiscal solvency and public debt” focuses on the starting condition (i.e. level of debt in comparison to productive capacity), “sovereign liquidity” assesses the momentum of key indicators such as fiscal & current account balance and debt service capacity.
External debt sustainability
CountryRisk.io’s analysis of a country’s external position considers its external liquidity and external debt viability. We use several metrics to measure external liquidity, including import coverage, external financing requirements as a percentage of GDP, and the International Monetary Fund’s (IMF) reserve adequacy ratio (RAR). Import coverage—expressed in numbers of months—depicts the adequacy of foreign exchange reserves to pay for imports. While this is a useful measure of external liquidity, it is narrowly defined and more appropriate for low-income countries, as defined by the IMF. We regard external financing requirements and RARs as more robust indicators of external liquidity, with the former taking into account sources of external vulnerability such as the size of a country’s current account balance, short-term external debt and principal payments. Clearly, without sufficient useable foreign exchange reserves, a country that is running current account deficits and facing significant payments due in the next twelve months is likely to run into liquidity issues.
Private sector strength
Strong and stable private and banking sectors are vital for the efficient capital allocation countries need to finance sustainable economic growth. History shows us that banking sector crises tend to result in significant economic output losses, lower growth prospects and, due to contingent liabilities, considerable deterioration in sovereign credit quality. This risk section includes, among other indicators, non-performing loan ratio (as a proxy for credit quality in the banking sector and overall economy), capitalisation ratio and overall indebtedness of households.
Climate change and renewable energy and biodiversity
Within the context of sovereign credit risk assessments, CountryRisk.io began with the premise that environmental factors are those that affect the sovereign’s physical assets and other inputs for production, which it could use (implicitly) as collateral for debt obligations. We then mapped the indicators we found to be material into two sections: (1) climate change & renewable energy, and (2) biodiversity.
Climate change has profound consequences on a country’s economic activity in many ways. In particular, physical risks stemming from rising average temperatures or extreme weather events, such as storms and droughts, could impair countries’ medium-term ratings whether or not they are rich in natural resources.
In general, countries prone to natural disasters could see downward pressure on their sovereign credit ratings from several sources, including lower output, increased public debt and deficit or a marked contraction in exports.
Another way in which resource-rich economies are vulnerable to climate change is the degradation of a natural environment from which they derive significant revenue and wealth. Although this may only impact their sovereign ratings over the medium-term, we must still consider mitigating factors that could maintain the sovereign’s current rating, such as policies designed to encourage economic diversity and reduce its reliance on a single revenue source.
Other environmental issues worth considering include the quality of the environment and its impact on public health, such as air pollution driving increased healthcare costs.
CountryRisk.io sees carbon-free energy as a mitigating factor against the growing impact of global warming. As many studies show, the energy sector is responsible for around two-thirds of greenhouse gas emissions, which makes carbon-free energy a safe, affordable and reliable way for a country to reduce its overall carbon footprint.
However, we must also bear in mind that the transition risks that arise as a country reduces its carbon footprint could also undermine its medium- to long-term ratings. Depending on a country’s energy strategy and the extent to which it is dependent on fossil fuels, the transition to a low-carbon economy could be disruptive and costly. The nature of a country's decarbonisation strategy, which includes the speed of transformation, policy coordination and other related technical issues, may expose the country to economic losses by way of asset write-downs or devaluations.[1]
CountryRisk.io considers biodiversity to be highly dependent on climate change. Combined with the effects of human activity, such as pollution, over-extraction, land degradation and deforestation, climate change is markedly transforming our ecosystems. Many plant and animal species are rapidly dying out, which will have extensive effects on air quality, fresh water availability, soil quality and crop pollination.
Social
Although social considerations might not seem particularly relevant to sovereign ratings, basic services to a country’s citizens are integral to ensuring social cohesion. In turn, the quality of such services tends to reflect the calibre of a country’s institutions and the strength of its policymaking. Indeed, as set out in the standard country risk framework, inadequate services will undermine fiscal finances over time, which may put pressure on a country’s rating.
The COVID-19 pandemic has exposed vulnerability in otherwise highly rated countries’ healthcare systems in terms of their quality, resilience and overall capacity to deal with a crisis. Meanwhile, indicators of overall population health include measures such as the prevalence of heart conditions.
Within our ESG sovereign risk model, the social risk factor is split into three subgroups: health, food security and poverty; education; and labour market & social safety nets.
Health, food insecurity and poverty: A healthy population is vital for economic development and progress. Ultimately, the current health of the population is reflected in its current average life expectancy, while its likely future health is indicated by life expectancy trends. Rising healthcare costs can put a substantial strain on public finances and depress productivity. Therefore, effective public healthcare systems are crucial not only for improving the overall health of the population, but also for healthy public finances. Relevant indicators for calculating the health risk score include the immunisation rate, access to clean water & sanitation and the impact of air pollution on health.
CountryRisk.io recognises food insecurity and poverty as key risk drivers for the social pillar, and we assess them along several dimensions. For instance, each could precipitate civil unrest in times of widespread, protracted economic hardship, which could affect growth as investments dry up. For countries whose initial debt sustainability conditions were already questionable, social instability may push them even closer to the brink. Food insecurity could also worsen if the country’s currency experiences a sharp depreciation, making food imports more costly.
Education: A key task of governments is to provide education for their citizens, including schools and universities, apprenticeship programmes and basic research and development. High-quality education fosters human capital, enables citizens to switch professions as required, and tends to be an important determinant of social cohesion. Learning is a lifelong activity facilitated by new technologies and has significant potential to reduce the risk of parts of society being left behind.
Labour market, social safety nets and equality: While the labour market plays a critical role in sovereign risk in several ways, the two principal factors are growth and public finances. In general, a country with low unemployment or full capacity suggests an efficient labour market which, in turn, indicates stable growth, a broader tax base and a lower fiscal burden for unemployment subsidies. Where unemployment benefits become necessary, we examine the extent of government support on the one hand and, on the other, whether such support is appropriately targeted to poor and vulnerable households. Economies thrive only to the extent that its citizens can take part in society and the economic process on an equal footing. First, inclusion refers to citizens’ ability to access not only education and healthcare, but also the banking system, formal labour market and democratic processes, such as elections. Second, equality means creating a level playing field for everyone and removing any form of unjust discrimination.
Data
In calculating the Sovereign Risk Index, CountryRisk.io utilises a wide range of indicators selected for their informational value and data availability. We source the data for these indicators from a wide range of reputable international multilateral institutions, including the World Bank and IMF.
Country coverage
The underlying geographic universe covers 190 countries and territories. However, country coverage varies across indicators. Besides country coverage, we selected the indicators on the basis of other criteria, such as:
- Available history: Is there a long history of regular updates? This allows us to assess whether an indicator is too volatile.
- Reporting lag/latest datapoint: When was the index last updated? Will it be updated again in the future?
- Methodology changes: Is the methodology used to calculate the index revised regularly? Frequent and significant changes lead to a lack of comparability over time, while modest changes suggest that the indicator continues to be developed to reflect a changing environment.
- Basis of indicator: Is the indicator based on original (survey) data, or is it a composite of other indicators?
As part of the index calculation, CountryRisk.io also provides a quantitative measure of data quality for each country. We base this measure on the number of available indicators for each country divided by the total number of indicators included in the model. The mapping table between the share of available indicators and data quality is shown below.
| Share of Available Indicators | < 20% | 20% < 40% | 40% < 60% | 60% < 80% | 80% < 100% |
|---|---|---|---|---|---|
| Data Quality Classification | Very Poor | Poor | Medium | Good | Very Good |
Methodology
CountryRisk.io uses a purely quantitative approach to calculate its ESG Sovereign Risk Scores.
Statistical models use quantitative methods to establish relationships between certain factors—for example, the rule of law—and the strength of debt sustainability in each country. Such models are less prone to bias than purely qualitative methods, which makes them useful in terms of tractability of results and consistency over time. That said, we also understand that statistical models are vulnerable to biases that can influence the process of selecting, specifying and calibrating the model. Furthermore, some indicators (e.g. institutional quality) reflect the subjective assessments of survey participants, although the large number of respondents significantly mitigates the adverse impact of that subjectivity.
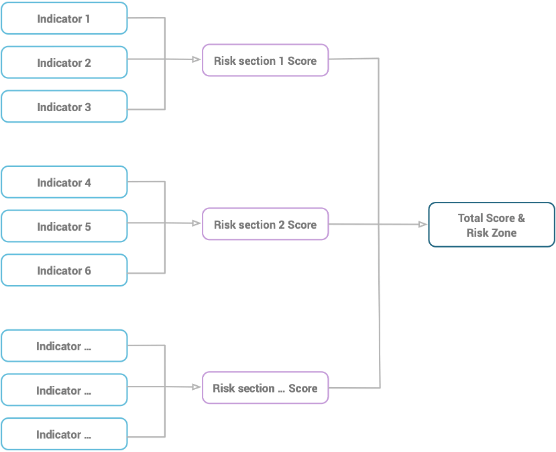
Each of the twelve sections in the ESG Sovereign Risk Scores includes several quantitative indicators (as shown in Table 1 above) to yield an initial score for each risk section. We then aggregate the risk sections—which are weighted to reflect their relative importance—to produce an overall risk score, which we finally map to the risk category and letter rating.
Figure 1 shows a schematic of this process.
The respective weights of each risk section are as follows:
| Risk Section | Section Weight |
|---|---|
| Economic growth prospects | 15% |
| Institutions and governance | 10% |
| Monetary stability | 10% |
| Fiscal solvency and public debt | 20% |
| Sovereign liquidity | 10% |
| External debt sustainability | 7.5% |
| Private sector strength | 7.5% |
| Climate change & renewable energy | 5% |
| Biodiversity | 5% |
| Education | 5% |
| Health, Food & Poverty | 2.5% |
| Labour market, social safety nets & equality | 2.5% |
Where no underlying indicators are available for a particular risk section, we distribute its weight between the other sections on a pro-rata basis to avoid the attendant risk of creating a downward bias in the overall risk assessment.
Quantitative assessment of indicators
We assess quantitative indicators by assigning values along a risk spectrum ranging from low to high. The risk spectrum is divided into several intervals and risk points are assigned to each interval. For example, higher quality of institutions and governance, such as the rule of law, indicates a greater likelihood that contracts can be enforced through the legal system. Therefore, in our framework, countries with a weaker rule of law receive more risk points than those with a stronger rule of law (see Table 4). For instance, where a country has a Rule of Law indicator rating of 25, we would assign it a score of 75 out of 100 risk points.
| Rule of Law | 0 < 40 | 40 < 50 | 50 < 60 | 60 < 70 | 70 < 80 | 80 < 100 |
|---|---|---|---|---|---|---|
| Risk points | 100 | 80 | 60 | 40 | 20 | 0 |
Interaction term between solvency and liquidity
Based on previous economic and financial crises, we find that there is an important feedback mechanism between solvency and changes to the liquidity situation of a sovereign that can affect a sovereign credit risk assessment. The deterioration of a country’s fiscal and current account has a more significant impact on its ability and willingness to repay its sovereign debt where government debt ratiois already high. In other words, a country’s fiscal space depends on its starting condition (e.g. given debt ratios).
We reflect this feedback mechanism in the CountryRisk.io ESG Sovereign Risk Scores. To do this, we take the standalone results of the “ESG sovereign liquidity” and “ESG fiscal solvency and public debt” risk sections as the basis of the calculation and map the two results to the respective tables shown below. For example, if the liquidity result of a country is 55 (which already signals a weak liquidity position), the liquidity adjustment factor is 7. If the solvency risk factor is 35 (which denotes a solid solvency position), the adjustment factor is 0.4. The total final adjustment factor is the product of both adjustment factors. In the given example: 7 x 0.4 = 2.8. Finally, we increase the final risk score by this number. The range of upward adjustment is between 0 and 10, or, in letter ratings, around two notches.
| Liquidity Section Result | 0 < 20 | 20 < 30 | 30 < 40 | 40 < 50 | 50 < 60 | 60 < 100 |
|---|---|---|---|---|---|---|
| Adjustment factor | 0 | 1 | 3 | 5 | 7 | 10 |
| Solvency Section Result | 0 < 30 | 30 < 40 | 40 < 50 | 50 < 60 | 60 < 100 |
|---|---|---|---|---|---|
| Adjustment factor | 0 | 0.4 | 0.6 | 0.8 | 1 |
Although this feedback mechanism leads to more variability of the risk scores over time, we find that this offers a useful reflection ofmarket dynamics.
Adjustment for large economies
Large economies benefit from higher resilience to adverse international shocks than smaller ones, as their sizeable resources and more diverse, dynamic economies allow their governments to respond to such shocks more flexibly. Similarly, large economies have more bargaining power in multilateral organisations and forums that affords them a greater ability push through certain policies.
As a result, larger, more mature economies benefit from a downward adjustment of their CountryRisk.io Sovereign Risk Scores of up to 20 points, as shown in the mapping table below. To date, the US and, increasingly, China, have been the main beneficiaries of this adjustment.
| Share of Global Nominal GDP (USD) | 0 < 1% | 1% < 5% | 5% < 10% | 10% < 15% | 15% < 20% | 20% and above |
|---|---|---|---|---|---|---|
| Adjustment factor | 0 | 2 | 3 | 5 | 10 | 20 |
Translating total risk points into risk categories
We convert each country’s total risk points as a share of maximum possible risk points into five category ratings ranging from “Very Low” to “Very High” sovereign credit risk. For instance, if the indicator assessments and their respective risk sections yield a total risk score of 35% (out of 100%), we map this score to the risk category of “Medium”. Table 9 summarises how we convert total risk points into a risk category. We also visually represent these ratings using a traffic light system with colours ranging from deep red to green.
It is important to note that there is no wholly objective way of determining the thresholds for each risk category. By and large, these aresubjective decisions that should align with the organisation’s risk appetite. Classifying too many countries as “Very High Risk” would lead to highly restricted business activities, while classifying too many as “Very Low Risk” would lead to un-provisioned risk in the business’s portfolio.
| Risk Points Range | Risk Category | Interpretation |
|---|---|---|
| 0 - 20 | Very Low | Very low risk that the government will not honour its foreign debt obligations. |
| 20 - 35 | Low | Low risk that the government will not honour its foreign debt obligations. |
| 35 - 47.5 | Medium | Some risk that the government will not honour its foreign debt obligations. |
| 47.5 - 62.5 | High | High risk that the government will default on its foreign currency debt obligations in the near future. |
| 62.5 - 100 | Very High | Very high risk that the government will default on its foreign currency debt obligations in the near future. |
Translating total risk points into letter ratings
We convert each country’s total risk points as a share of maximum possible risk points into the standard sovereign credit ratings ranging from AAA to CCC. The mapping table is shown below.
| Sovereign Risk Score Range | Letter Rating | Risk Level | Interpretation | |
|---|---|---|---|---|
| — | — | D | In Default | The country is currently in default on some or all of its obligations. |
| 60.00 | 62.49 | C | Speculative Grade | Very highly speculative credit quality and high default risk. Default can be avoided only in a favourable economic environment. |
| 57.50 | 59.99 | CC | ||
| 55.00 | 57.49 | CCC | ||
| 52.50 | 54.99 | B- | Speculative Grade | Highly speculative credit quality reflects elevated uncertainty about the country’s ability and willingness to repay its obligations. While current financial obligations are honoured, a deterioration of the economic environment, external account, indebtedness or heightened political uncertainty all have the potential to challenge the country’s capacity to honour its obligations. |
| 50.00 | 52.49 | B | ||
| 47.50 | 49.99 | B+ | ||
| 45.00 | 47.49 | BB- | Speculative Grade | Speculative credit quality reflects uncertainty about the country’s ability and willingness to repay its obligations. Issuer credit risk is vulnerable to unexpected changes. |
| 42.50 | 44.99 | BB | ||
| 40.00 | 42.49 | BB+ | ||
| 37.50 | 39.99 | BBB- | Investment Grade | Good credit quality reflects a low expected credit risk. Unexpected changes in the domestic or global economic environment or structural changes are more likely to impair the credit quality. |
| 35.00 | 37.49 | BBB | ||
| 32.50 | 34.99 | BBB+ | ||
| 30.00 | 32.49 | A- | Investment Grade | High credit quality with capacity and willingness to honour its obligations. That said, credit risk is susceptible to deterioration in the case of unexpected changes of the country’s fundamentals or its economic outlook. |
| 27.50 | 29.99 | A | ||
| 25.00 | 27.99 | A+ | ||
| 20.00 | 24.99 | AA- | Investment Grade | Very high credit quality with ample capacity and proven willingness to honour its obligations. Credit quality is only marginally weaker than the highest credit quality of AAA-rated issuers. |
| 15.00 | 19.99 | AA | ||
| 10.00 | 14.99 | AA+ | ||
| 0.00 | 9.99 | AAA | Investment Grade | Highest credit quality accorded to the greatest capacity and willingness to honour its obligations. Credit quality is unlikely to be weakened by foreseeable events. |
Governance process
- Update frequency: We update our ESG Sovereign Risk Index and publish it on the CountryRisk.io Insights Platform towards the end of each month. In addition, we update the data on an ad hoc basis whenever substantial new information becomes available.
- Model review and adjustments: CountryRisk.io strives to continuously improve its methodology, such as by incorporating new high-quality indicators as and when they become available. CountryRisk.io also consults external experts to review the model and any adjustments we make to it. We will reflect any changes in future versions of this methodology document.