What we learned from the 2022 SDG Index

Bernhard Obenhuber
Jul 05, 2022
In early 2022, just as the world was emerging from a global pandemic, another humanitarian crisis struck. The consequences of Russia’s unprovoked war on Ukraine have reached far beyond its borders. Virtually no country has been spared from skyrocketing food and energy prices. And after COVID-19—which is still classed as a pandemic—all but put the Sustainable Development Goals on hold, the latest SDG Index shows that the conflict in Eastern Europe is ensuring they stay that way.
Going nowhere fast
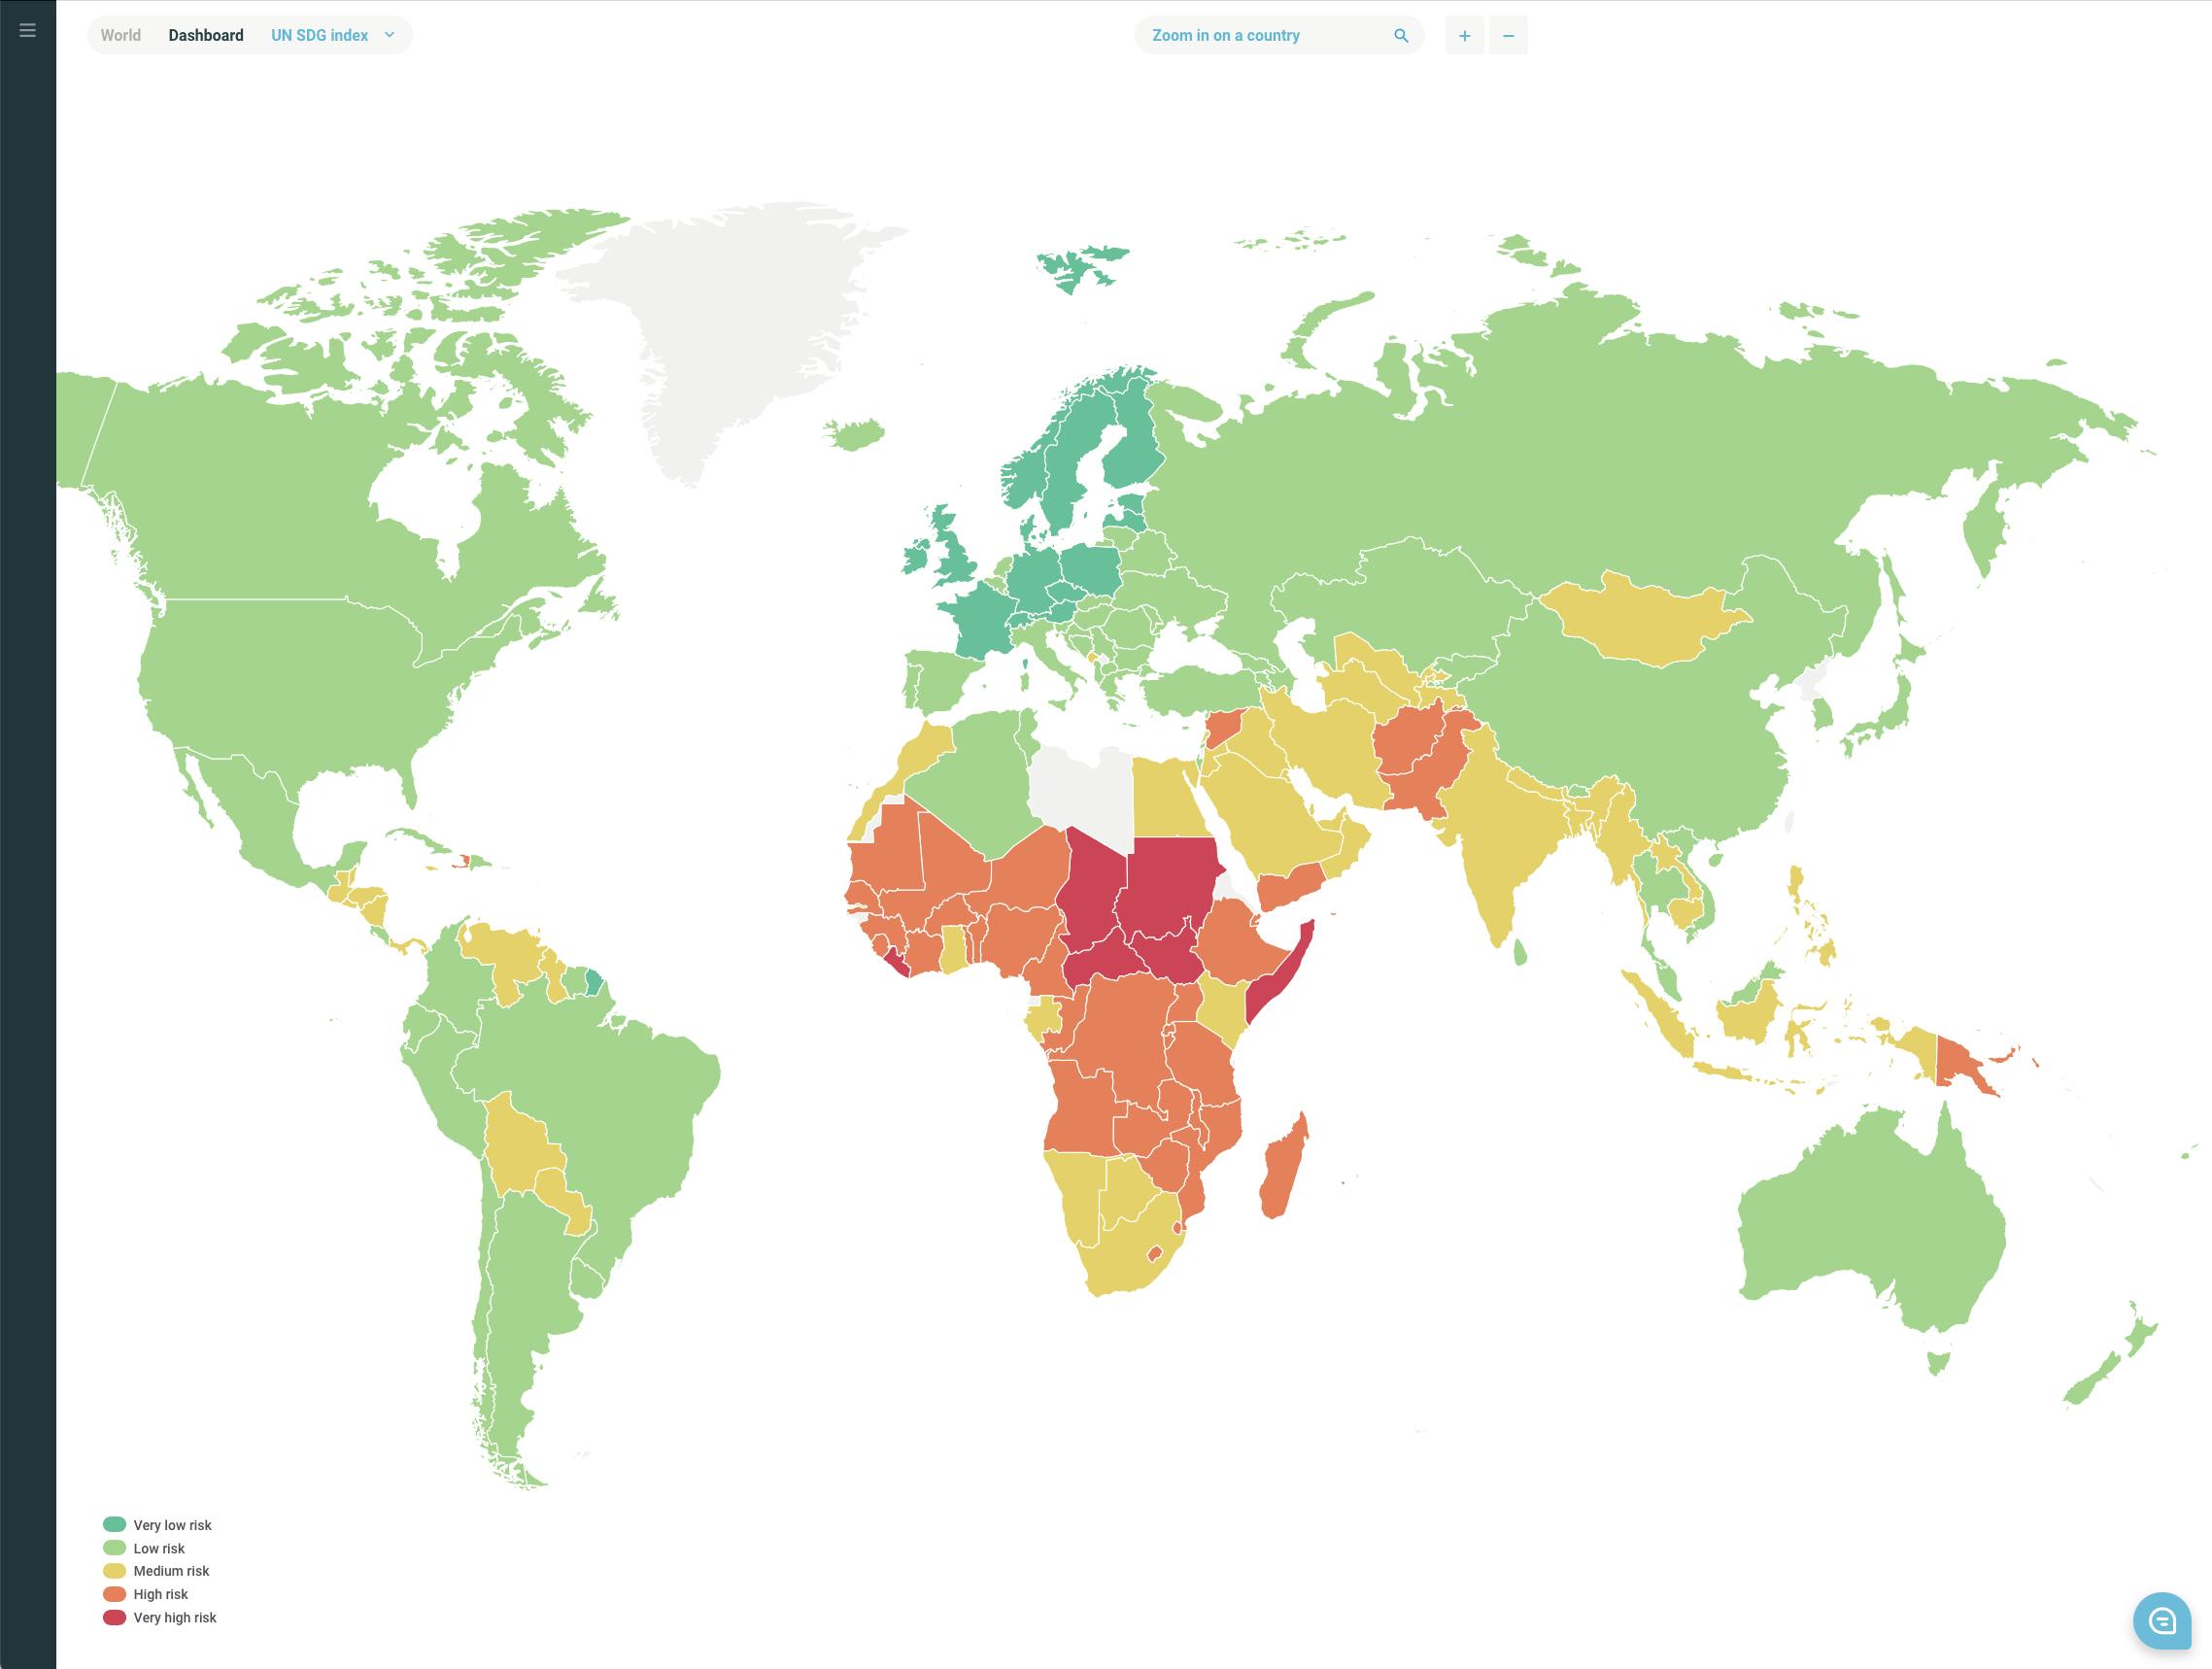
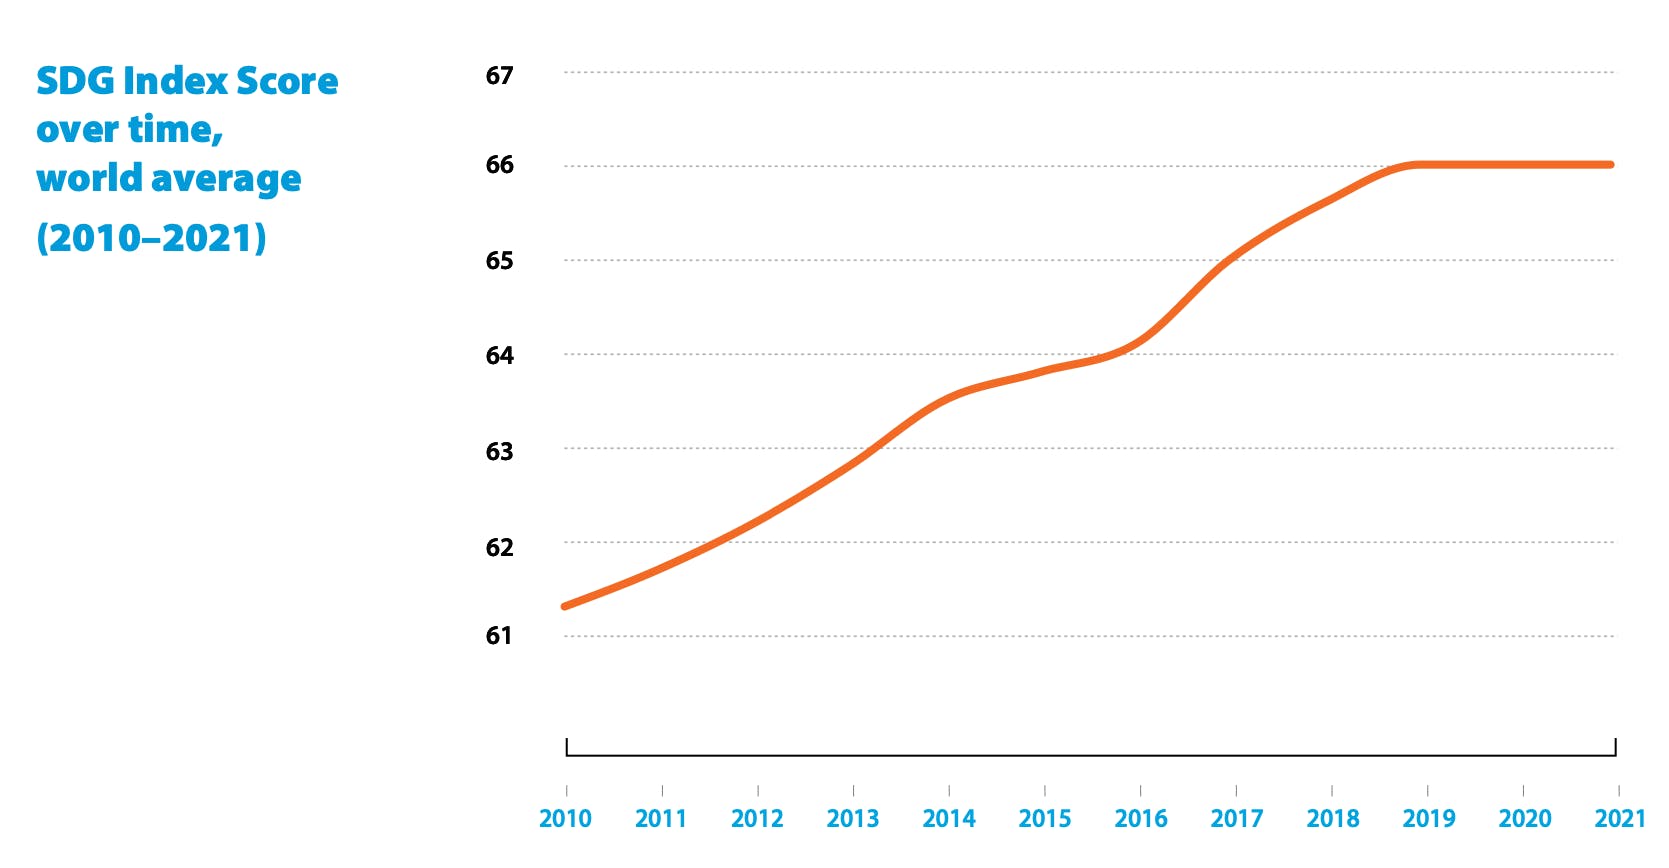
The Sustainable Development Solutions Network’s (SDSN) 2022 Sustainable Development Report includes the latest Sustainable Development Goals (SDG) Index, which provides a country-by-country summary of progress. This year, the Index once again shows a world in stasis. Following the destructive impact of the pandemic, this marks the second year in a row in which the world average SDG Index Score has remained static.
“At the mid-point on the way to 2030, few nations are really thinking and acting for the long term,” says Guillaume Lafortune, Vice President and Head of Paris Office at the SDSN. “Peace, international cooperation, and access to financing are fundamental conditions for restoring and accelerating SDG progress by 2030 and beyond. These need to be accompanied by stronger connections between the quality and robustness of long-term development/SDG plans and access to financing, in particular for the least developed countries (LDCs). Financing constraints hold back SDG success, especially in the poorest and most vulnerable countries.”
With the global Index Score remaining stagnant at 66% and (due to reporting lags) the underestimation of certain input statistics, achieving the SDGs by 2030 is looking increasingly unlikely. The pandemic and the war in Ukraine have ensured the most severe impacts on SDG 1: No Poverty and SDG 8: Decent Work and Economic Growth. Andthanks to soaring prices and ongoing depressions in major income sources—such as trade, tourism, and other service sectors—low-income countries (LICs) have been hit hardest, after having made significant progress towards ending extreme poverty and providing basic services (e.g. SDG 3: Good Health and Well-Being) before COVID-19.
In contrast, many high-income countries (HICs) saw their unemployment rates fall between 2020 and 2021, underscoring the uneven consequences of the pandemic. That said, should inflation continue to weigh on growth and—after raising salaries to attract workers due to increased demand in several sectors—companies begin to retrench their workforces, this may eventually prove to be short-lived.
Scandinavians on top
Finland once again topped the Index with a score of 86.5, up from 85.9 in 2020. Denmark, Sweden, and Norway round out the top four, all of which were classed as either on track or maintaining their SDG progress. Given everything that’s happened since 2020, these are impressive results. However, it remains to be seen whether these countries will be able to do enough to achieve the SDGs by 2030, especially as Russia continues its invasion of Ukraine. And while Finland and Sweden are bidding to join the North Atlantic Treaty Organization (NATO), whether they’ll be successful and, more importantly, see significant benefits from membership is still anyone’s guess.
Meanwhile, the bottom of the SDG Index is once again populated by African countries. South Sudan fared worst with a score of 39.05, and (in ascending order) the Central African Republic, Chad, Somalia, and Sudan complete the bottom five. This comes as no surprise. Poorer countries with stretched public finances typically have no access to international capital markets, which limits what they can borrow to support their economies during difficult times. As a result, for most or even all of the SDGs, such countries are at a significant disadvantage.
International Spillover Index
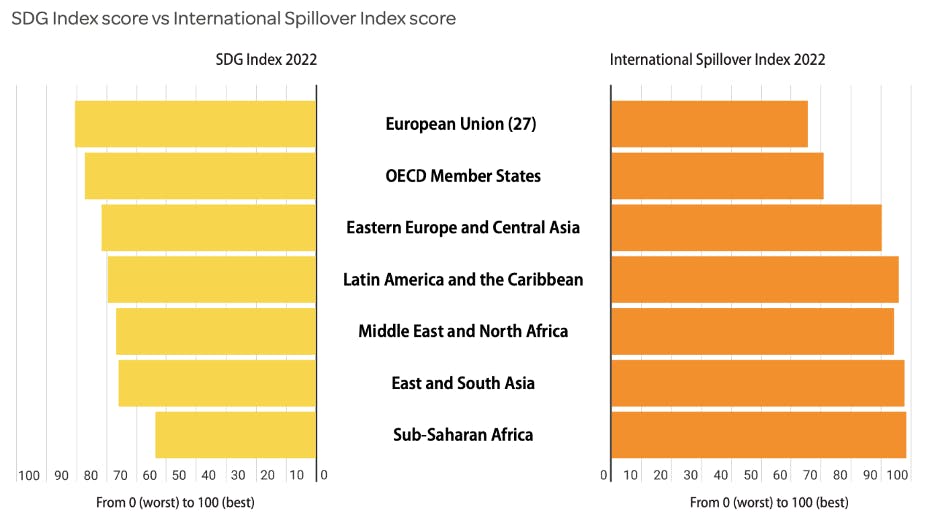
Among a wealth of other metrics and insights, the Sustainable Development Report 2022 also includes the International Spillover Index, which shows sustainability to be a global challenge that requires us to consider how the each country’s actions affect others. It does so by scoring countries on the extent to which they impact other countries’ efforts to achieve the SDGs through the positive or negative externalities they create. For instance, a country may have made significant progress in reducing its emissions and improving human rights within its borders. But it could also be indirectly responsible for increasing emissions or impeding progress on human rights in other countries through the goods it imports—such as fast fashion, which faces challenges in both of these areas—or by exporting its waste to countries with lower environmental and social standards. Generally, the research found that, although wealthier countries tend to have higher SDG Index scores, they also tend to create more negative externalities than poorer countries. In other words, some of the progress richer nations seem to have made on the SDGs amounts to outsourcing their problems to countries which lack the resources to solve them.
Government commitments
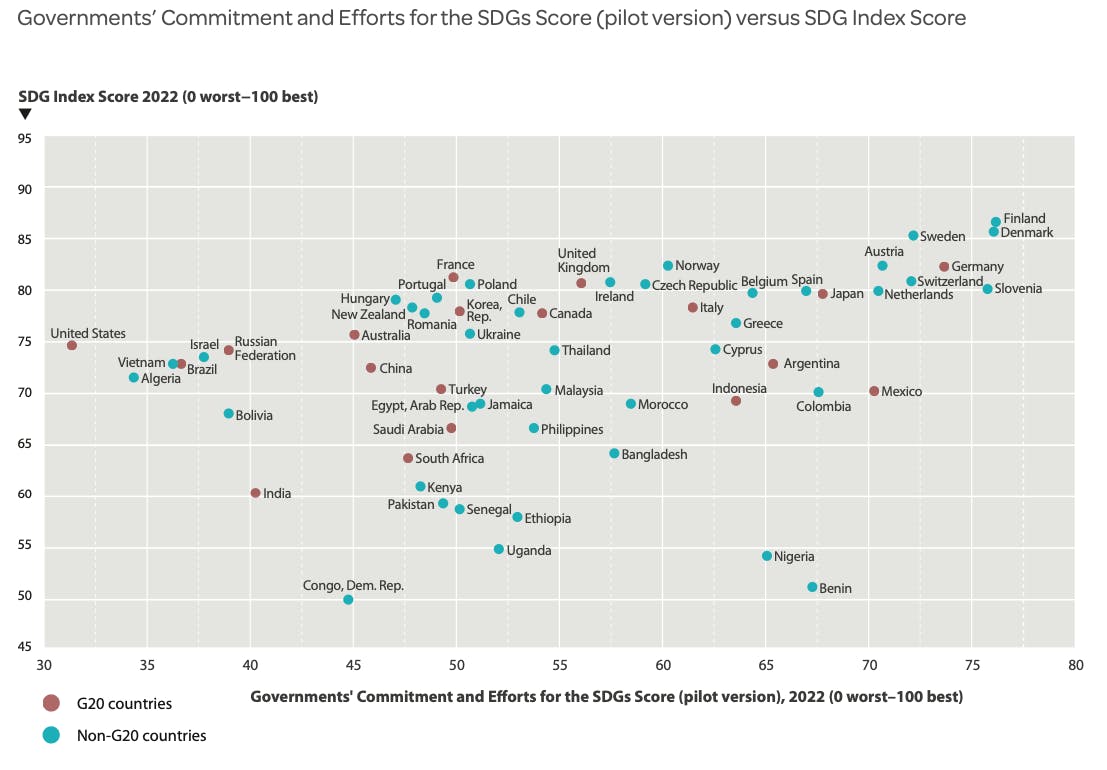
We have often argued that assessing a country’s path towards achieving the SDGs requires a good understanding of its policy efforts and commitments. Because policy is what will shape the evolution of the underlying SDG indicators. To that end, this year’s Sustainable Development Report also scores countries’ policy commitments. And, as we can see as in the chart below, global policy efforts still leave a lot to be desired—even from the Scandinavian star SDG performers. With so much work left to do, we think that monitoring policy efforts is only going to become more important.
Why the SDG Index is our preferred sustainability metric
At CountryRisk.io, we integrate the SDG Index into our platform because we find it to be the best indicator of countries’ relative progress. Here’s why:
- Independence: The SDSN is an independent organisation and we see no conflicts of interest.
- Transparency: The SDG Index ticks all the data and methodological transparency boxes, including data provenance, applied imputation, thresholds, and justification of the indicator optimum. The SDSN’s efforts in these areas also enabled a successful audit of the statistics.
- Expertise: Given the official UN target metrics, putting together an SDG Index might seem straightforward. But anyone who has attempted a similar project knows that many challenges are bound to arise, especially around poor data quality. The SDSN’s team has the specialised knowledge required to select meaningful alternatives to the official target metrics.
- Network: When it comes to assessing policy commitments, no individual organisation can go it alone. The SDSN draws upon a large network of partners with local expertise.
Upcoming webinar with Guillaume Lafortune
If you’d like to learn more about the latest SDG Index and the challenges of addressing sensitive topics like international spillover and policy commitment scoring, join us for a CountryRisk.io webinar on Tuesday, 12th July at 3pm (CET). Our special guest will be Guillaume Lafortune, Vice President and Head of Paris Office at the SDSN and one of the authors of the Sustainable Development Report 2022. You can register here (link).