How we assess country risk
Part 1: Search for sovereign default data

Bernhard Obenhuber
Nov 10, 2023

Even after decades analysing country and sovereign risk, we still get excited about it. And having witnessed several economies either collapse or come very close to doing so, we’re always asking ourselves why some nations succeed while others fail.
Why do countries default on their debts? How much of a role does each factor play? How do we forecast a default? And how do we express all this as a set of scores that reliably reflects the level of risk associated with each country? This final question is perhaps the most important one we ask ourselves. We will answer these questions step by step and will do so in a series of blog posts.
First, though, we need to precisely specify what it is we’re trying to measure. As sovereign credit risk analysts, our target measurement is clear: how likely is it that the country’s government will fail to meet its foreign or domestic bond obligations? Or, in short: what is the risk of a sovereign default?
What regime are you in?
To assess a country’s current credit risk, we need a model and accompanying indicators capable of telling us how likely its government is to default on its debts. And to find such indicators, we need to identify common patterns in historical country data.
Specifically, we want to find patterns that enable us to retrospectively differentiate between three country states, or regimes:
- Tranquil regime: The sovereign honours its debt obligations.
- Pre-default regime: The sovereign defaults on its debts within the next few years.
- Default regime: The sovereign has stopped paying interest and/or the debt principal, causing at least one of the Big Three rating agencies to declare a default.
Once we’ve identified patterns for each of these regimes in historical data, we can search for them in more recent data. In other words: we can use these patterns as indicators of which regime a country is most likely in today, and assign the country a score that reflects the risk of an imminent default.
Finding indicators for default regimes can be interesting, but they might not be useful for pre-default regimes unless you’re also able to forecast their appearance, which just shifts the problem. Since we want to be able to anticipate a default as far in advance as possible, we’ll explore how we identify likely pre-default regimes in a separate article. For now, though, let’s concentrate on the actual default episodes. A comprehensive list of historical defaults, including the date and country of their occurrence (for a statistically meaningful analysis).
In search of sovereign defaults
Perhaps surprisingly, finding useful sovereign default data is a significant challenge for many researchers. In the next paragraphs, we outline why and how we address it at CountryRisk.io.
Since we want a list of historical sovereign defaults as declared by one of the Big Three rating agencies, Fitch, Moody’s, and S&P all seem like good places to start. Indeed, each agency typically publishes annual reports containing such information, like this list of foreign currency sovereign defaults from a recent S&P report:
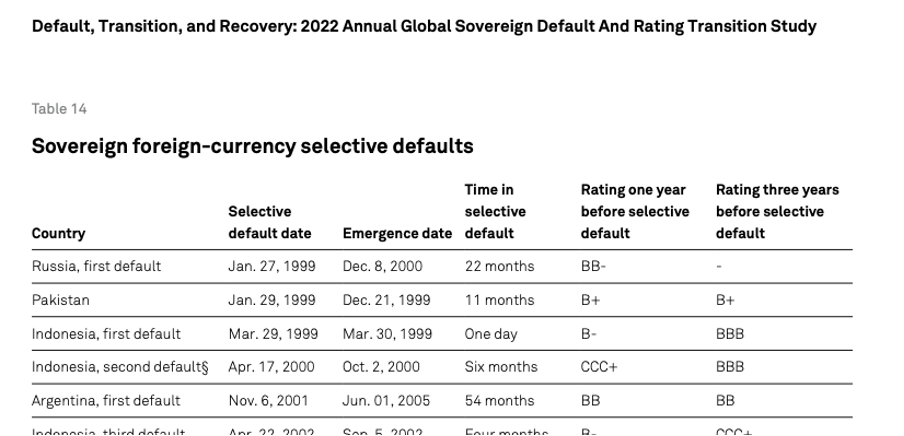
The full list contains 49 default events, and the chart below shows how many occurred during each year of the period covered. Which, unfortunately, only goes back to 1999:
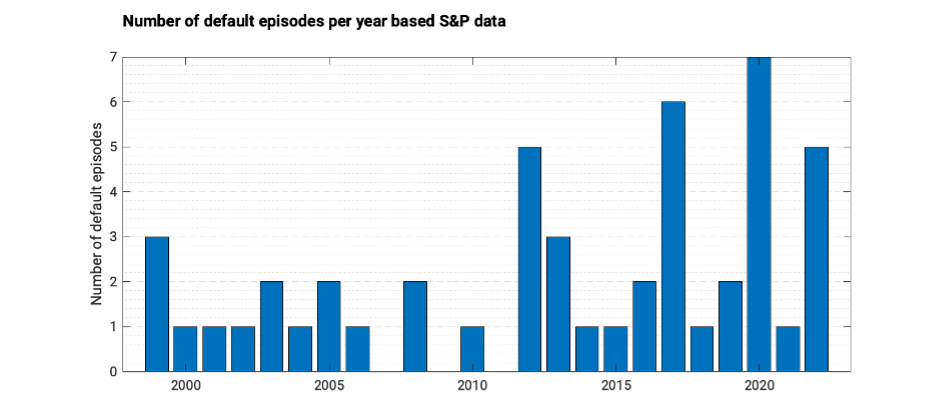
Besides the relatively short reporting period, another problem is that this list contains several repeat offenders. The 49 defaults occurred across 27 countries, which averages out to around 1.8 defaults per sovereign. And yet, Argentina and Belize racked up five defaults each, making just two Latin American countries responsible for nearly 20% of the defaults declared by S&P since 1999.
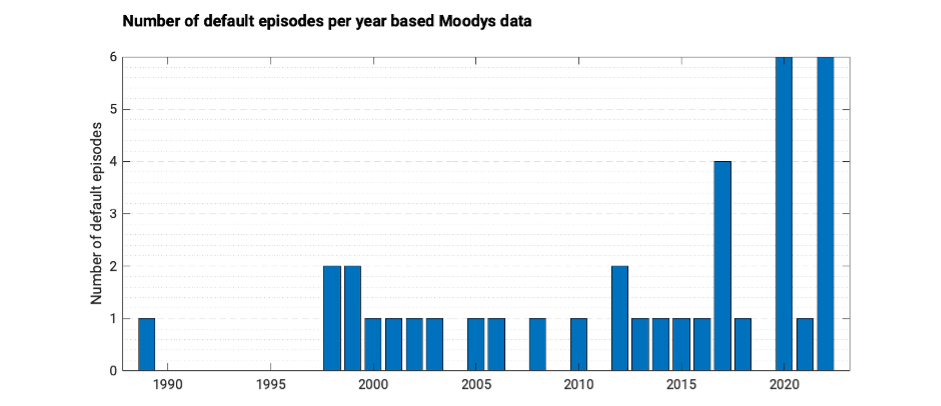
Things aren’t much better at the other two rating agencies. Although Moody’s have an extra 16 years’ worth of data going back to 1983, the agency still only lists 37 defaults, many of which already appear on the S&P list:
And Fitch, which covers 1995–2022, lists just 23 defaults:
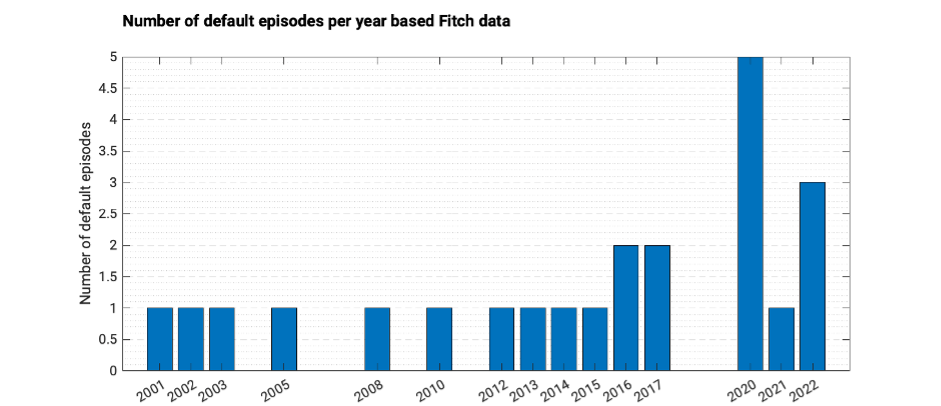
Besides adding little to the picture, the fact that these three charts often show different numbers of defaults occurring in the same year means that we need to examine every event listed by the Big Three agencies to get a consolidated list of defaults that’s free of duplication.
This is the point at which any statistician might start to worry. After all, if we want to find default indicators that we can apply to any country, we need default data that is internationally representative. What we get from the Big Three agencies, though, is a lack of overall events, an uneven distribution of defaults between countries, and, as a result, multiple overlapping pre-default periods. One might reasonably question the wisdom of using any patterns we might find in these particular countries’ historical default data as indicators of an impending default in other countries—not to mention making investment decisions based on such indications. The limited number of sovereign defaults makes us also very hesitant to use “sophisticated” big data models. While such models are very useful in other areas such as estimating corporate default probabilities, as one has thousands or even millions of default data points and not just around 40 spread across just 30 odd countries.
Broadening our horizons
So, although we’re looking for indicators that a country will soon have a default declared by one of the Big Three rating agencies, the relatively short period covered by their historical lists of declared defaults forces us to look elsewhere.
Several academic research projects have built excellent databases of historical defaults and other crisis events, and we find the following to be particularly valuable for our purposes.
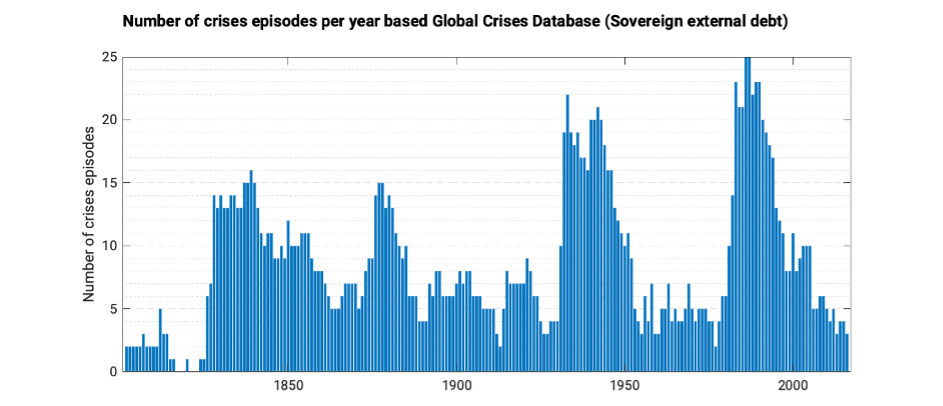
Harvard Business School: Global Crises Data by Country
Collected and maintained by Carmen Reinhart and her co-authors Vincent Reinhart, Ken Rogoff, and Christoph Trebesch, Harvard Business School’s Global Crises Data by Country lists events including banking, systemic, inflation, and external debt default crises. While these default data cover a much longer period than those of the rating agencies, they’re still limited in that the authors provide a Boolean value for every year a country is in default, not just the year of the initial default.
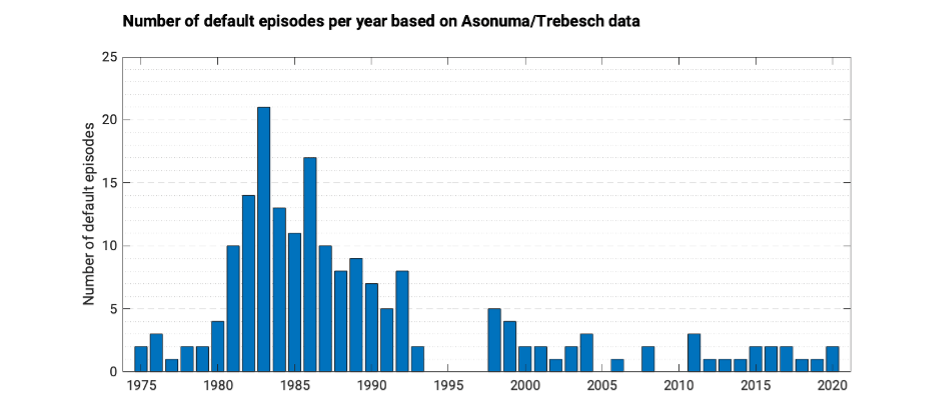
Asonuma and Trebesch: Monthly sovereign default dataset
Among this collection of datasets is the ‘Monthly sovereign default dataset’ by Tamon Asonuma and Christoph Trebesch, which includes many default events that occurred during the debt crisis of the ’80s .
Bank of Canada and Bank of England: Sovereign Default Database
The Banks of Canada and England maintain another great resource in the form of their Sovereign Default Database, although this doesn’t include dates for individual default events.
CountryData.io for ease of access
As we frequently use data from all the sources we’ve mentioned so far, we created CountryData.io—our data management platform—so we can access all of it in a standardised way. And, with just a few lines of code, CountryData.io allows us to easily work with data from multiple sources simultaneously, without having to expend time and effort downloading spreadsheets, parsing the information, and aligning the various datasets.
If you think CountryData.io could add value to your work, or have any suggestions for other datasets that might be useful in tracking sovereign defaults, you can email us at [email protected].
Which indicators matter?
Now we have as much default data as we can find, we can now study a wide range of potential indicators to see if any patterns appear in the data during the ten years before and after these historical default events. We will do a deep dive into selecting and assessing indicators in a future blog post.
At CountryRisk.io we do a lot of data investigation to find relevant indicators for our risk scores, and we’ve included graphs for a selection of the indicators we’ve identified that show how they behaved around the default events we studied:
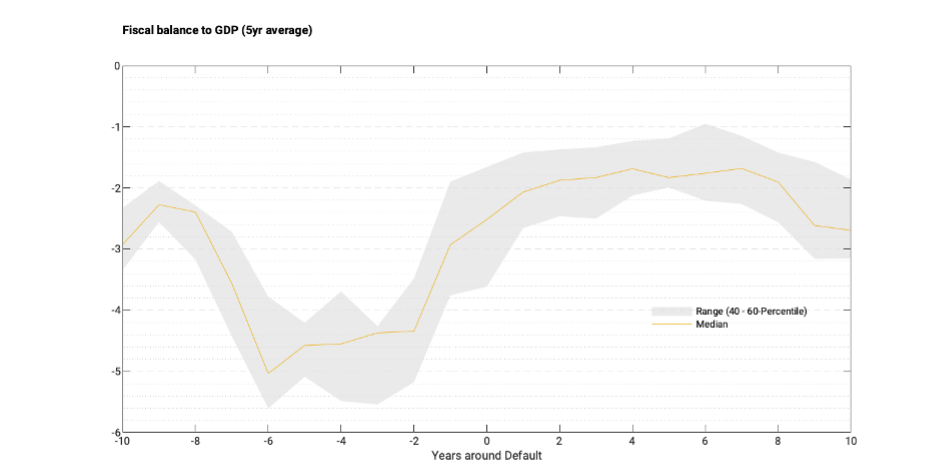
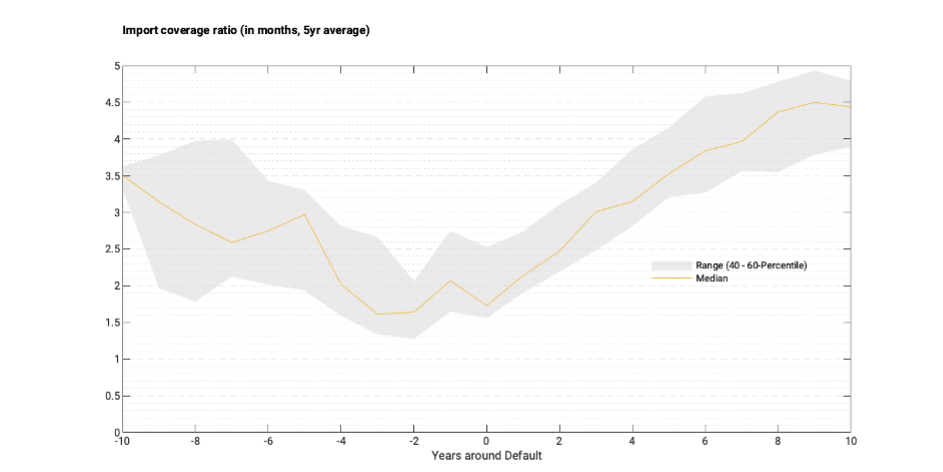
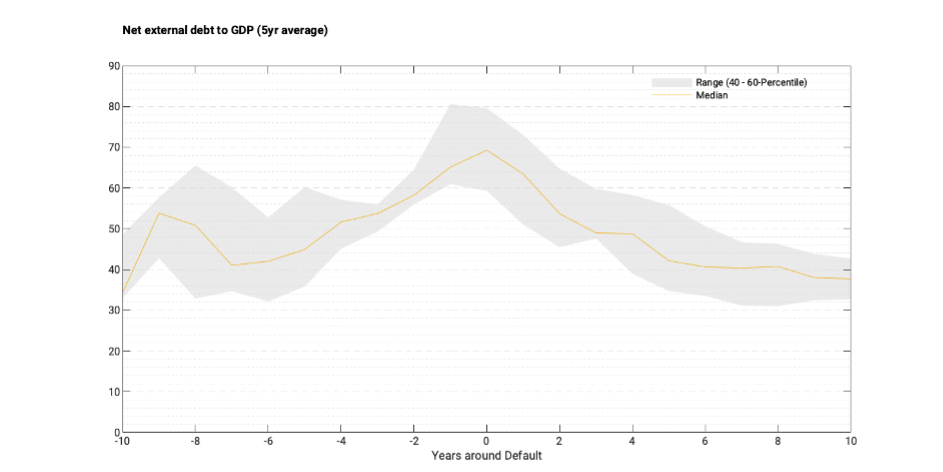
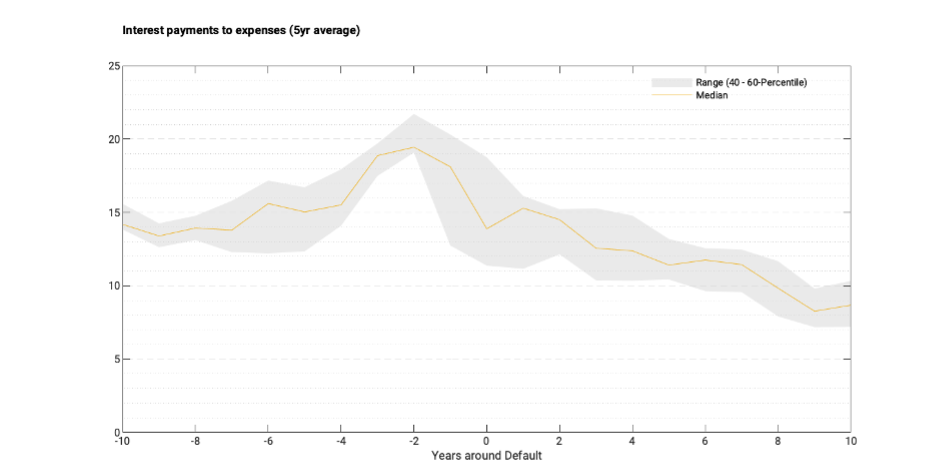
Because we were able to identify only a fraction of all historical sovereign defaults and the indicator data vary significantly for each country, we must be careful not to overestimate the predictive power of these indicators. Moreover, every country and crisis is unique, and so too are the factors that actually cause sovereigns to default in each case. Nevertheless, the signals we identified in the historical data are clear enough to make these indicators sufficiently useful for monitoring country risk.
We incorporate the full set of indicators into a model that defines how we calculate the CountryRisk.io Sovereign Risk Score. This final plot shows how the median Sovereign Risk Score behaves in the period before and after a default, along with the full range of risk scores we’ve observed around such events:
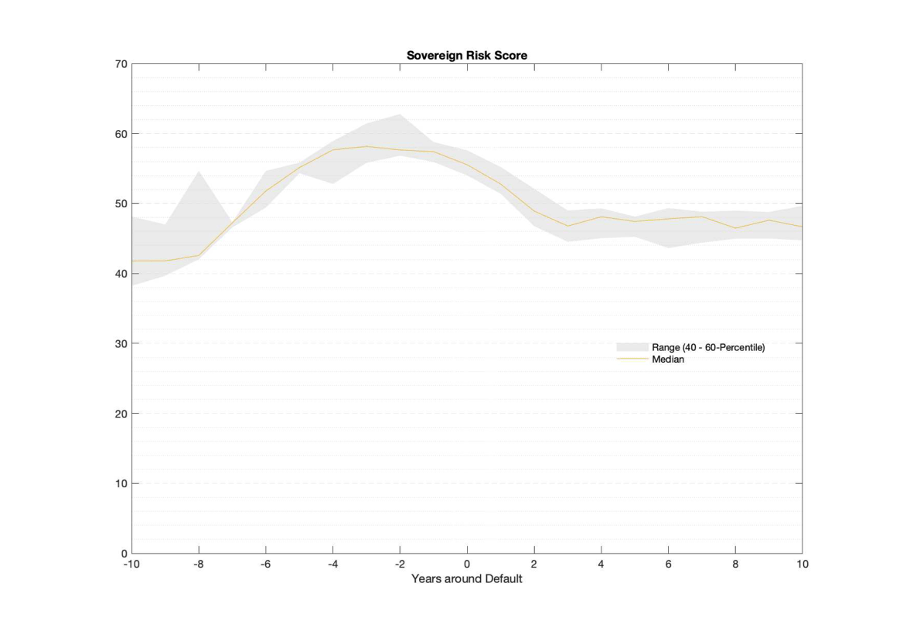
This graph shows that a country’s risk score will typically increase from just over 40 to nearly 60 in the decade preceding the default, and that this increase is usually detectable at least three years before the event occurs.
In other words: most sovereigns manage to muddle through for some time. Fortunately for us, this gives us two potential early warning signals for sovereign default:
- An elevated risk score
- Negative risk score momentum over the past decade
Your early warning system
We use our Sovereign Risk Scores to efficiently and consistently monitor around 200 countries. Meanwhile, the CountryRisk.io Sovereign Rating model enables our community members to conduct country deep-dives that combine quantitative and qualitative data. And our ‘Early Warning System for Currency Crises’, which includes more frequent indicators, completes the toolset (Link to blog post).
If you’d like to find out more or share your own ideas for new approaches to sovereign risk analysis, we look forward to hearing from you at [email protected].