Why ‘No Code’ Wasn’t Enough: Lessons from Country Risk Modelling

Bernhard Obenhuber
Apr 23, 2025

In recent years, low-code and no-code platforms have gained significant traction in the field of data analytics. They offer the enticing promise that anyone can create a country risk model or ranking just by dragging and dropping predefined components. By simplifying the complexities involved in traditional model development and programming languages like R, Python, or Matlab, these platforms imply that anyone can step into the role of a data scientist.
At CountryRisk.io, we wholeheartedly support the idea of making data analytics accessible to everyone. But – our experiences in building and using these tools have revealed some crucial limitations to this approach. Let’s explore some of the insights we’ve gained from our journey.
Score Builders: World Bank and CountryRisk.io
Let’s explore two applications: the Score Builder on the World Bank’s Sovereign ESG Data Portal and our very own ESG Index Builder. Both of these tools are designed to help users create customised ESG risk indices by selecting from a range of environmental, social, and governance indicators.
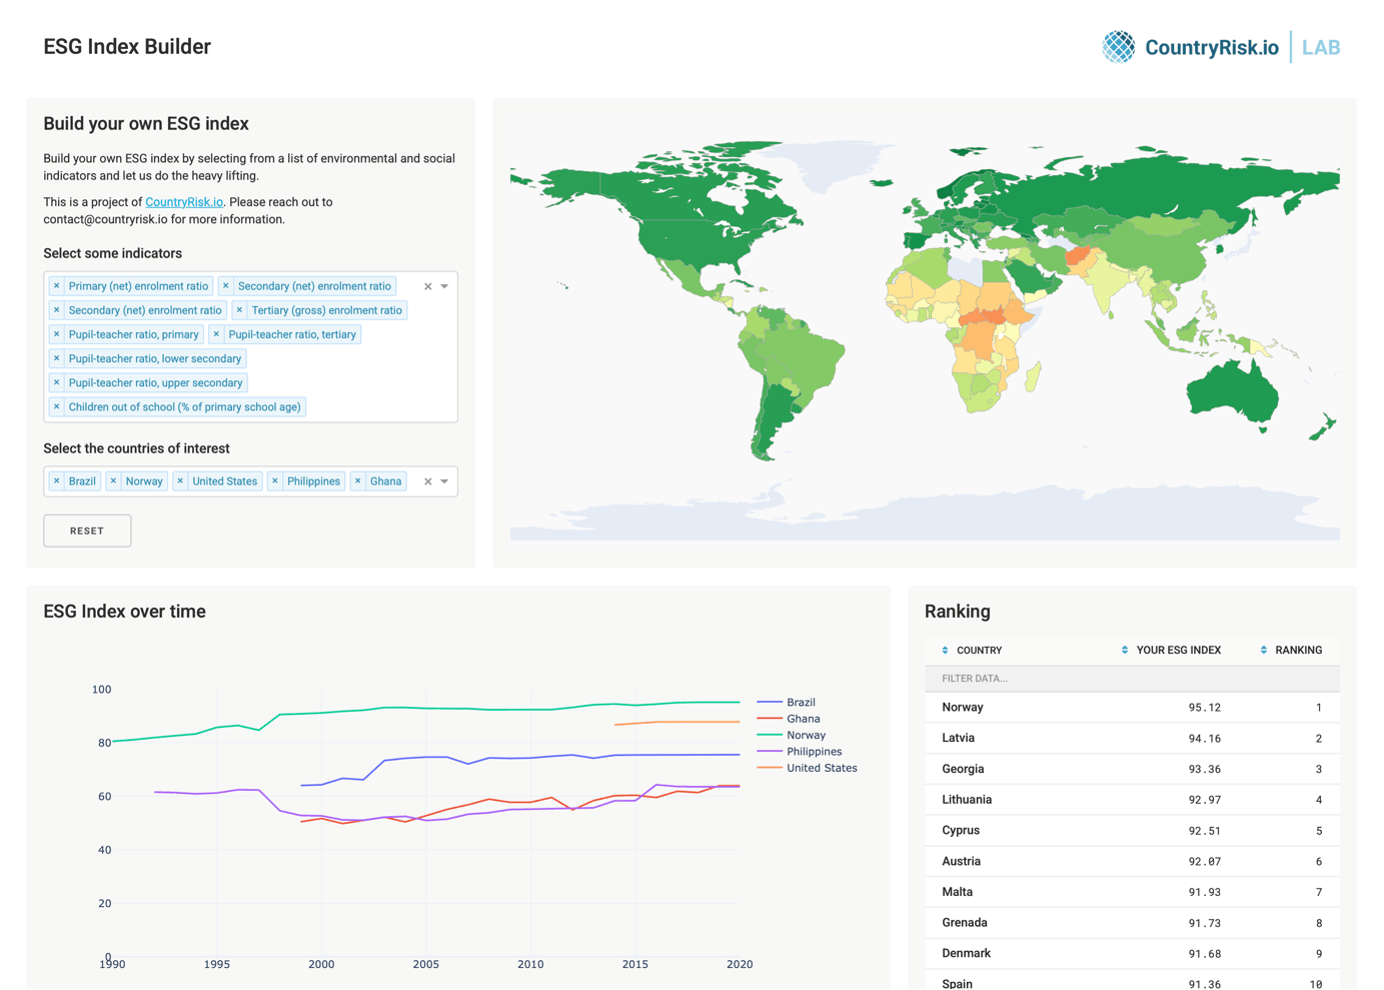
1 – 2 – 3 – Done?
The basic process is straightforward:
- Choose your indicators.
- Set your transformations.
- Select countries.
In our ESG Index Builder, we handle the transformation step for you. To ensure that data are comparable across indicators and countries, we standardise each indicator on a scale from 0 to 100, where 100 reflects the best ESG performance (for instance, having no children out of school).
We apply two main scaling techniques:
- “Bounds”: This is applied when an indicator has a defined range. For example, the primary enrollment ratio ranges from 0% to 100%, so a country achieving 100% gets a perfect score.
- “Bounds percentile”: For indicators with no fixed bounds, we implement percentile-based scaling. For example, with the pupil-teacher ratio, we determine the 2nd and 98th percentiles over time to set comparative benchmarks. A country at or below the 2nd percentile gets a score of 100, indicating an excellent teacher-student ratio.
Additionally, we perform key data transformations, including:
- Inverting indicators where lower raw values indicate better outcomes (like children out of school).
- Measuring relative or absolute changes over time.
- Formulating ratios, such as deaths per capita for conflict-related indicators.
The World Bank’s Score Builder operates on a similar principle, offering users a variety of transformations such as Log10, Diff, Growth, Min-max, Z-score. While this may seem versatile on the surface, the intricacies can be quite revealing.
Take, for example, the indicator for School enrollment, primary and secondary (gross), gender parity index (GPI). It’s a key metric for tracking gender disparities in education, calculated as the ratio of girls to boys enrolled. A GPI of 1 indicates equality; values below 1 indicate that girls are at a disadvantage, while values above 1 suggests boys are favoured.
This creates a challenge: the relationship between ESG performance and the indicator value is not linearly related to the indicator value. Unfortunately, none of the transformation options provided by the World Bank effectively tackle this issue—unless the z-score is adjusted to a fixed mean of 1, which seems not to be the case. At CountryRisk.io, we addressed this by implementing a symmetric transformation that equally treats deviations from 1, regardless of direction. While such symmetry issues are uncommon, they are crucial. Other examples include:
- Inflation rate: Both deflation and hyperinflation pose challenges.
- Government revenue as % of GDP: Both excessively low or high values can indicate potential risks.
Lesson 1: Understanding the properties of each indicator is essential.
The Value of Flexibility
Often, true insights emerge from creating derived metrics that combine various indicators. For example, one might explore the relationship between economic growth and CO2 emissions, moving beyond conventional energy intensity measures.
Flexibility also enables the exclusion of misleading data points. Take forest loss, which is typically measured as a percentage change over time. This method works well unless a country has very little forest cover—where even minor absolute increases can lead to disproportionately large percentage changes. A more effective strategy could involve combining percentage changes with a minimum threshold for forest coverage or incorporating an additional, complementary metric.
Lesson 2: Transforming indicators flexibly reveals richer insights
The Recipe is Key
Building a robust economic model or risk score involves more than tossing indicators into a pot and stirring. It begins with a clear definition of what you aim to measure. Next, you need a thoughtful approach:
- Breaking down the main goal into meaningful sub-topics (like education quality and basic service accessibility).
- Ensuring balanced representation by using appropriate weights.
- Considering how indicators interact with each other.
At times, the interpretation of one indicator relies on the context provided by another, adding further nuance to the model’s design.
Lesson 3: The architecture of your model is just as crucial as the selection of your indicators.
Our Core Principles at CountryRisk.io
Through the ESG Index Builder and numerous other analytics projects, we’ve established several core principles:
- Access to high-quality data should be straightforward: Gathering and standardising data can often take longer than the modeling process itself. That’s why we created CountryData.io—to simplify data access for both our team and our clients.
- Choose the appropriate tools for the task: Although this blog post emphasises basic scoring, this principle is even more applicable to complex models (like ensemble machine learning models). Programming languages offer significantly more flexibility and analytical capabilities.
- Implement your models effectively: It’s not enough to build a one-off model in a Jupyter notebook. For it to be used in production, you need automation, version control, and regular updates. That’s baked into our server-side model deployment on CountryData.io.
- Facilitate easy sharing of results: Analytics are most beneficial when they can be seamlessly integrated into workflows. CountryData.io provides API endpoints that allow users to programmatically retrieve model outputs.
genAI Will (Not) Solve It (Yet)
At CountryRisk.io, we’re enthusiastic about the possibilities of generative AI. But we’re not at the point where we can just say, “Build me an ESG risk score” and expect a useful outcome beyond no-code templates.
However, genAI can support analysts in various stages:
- Ideation: Propose factors or modeling approaches.
- Indicator identification: Navigate databases and grasp the subtleties of indicators.
- Coding assistance: Produce code snippets in your chosen language.
- Result presentation: Create interactive ways for stakeholders to engage with data.
We leverage genAI to effectively convey both the results and the methodology—offering valuable context for decision-makers.
Country Risk Analysis, Simplified!
This is the heart of our mission. At CountryRisk.io, we create tools that empower users to concentrate on analysis rather than technical hassles. Whether your goal is to manage risk, inform investment decisions, or reduce sovereign borrowing costs, we strive to eliminate obstacles and expedite your progress. Contact us if you want to learn more.