InsightsManaging Divergent Ratings: Changes to our ratings following the IMF Spring Meetings
Managing Divergent Ratings: Changes to our ratings following the IMF Spring Meetings
Dr. Moritz Kraemer May 20, 2021
Tidal Basin, Washington, D.C., Photo by Andy He, Unsplash
Unlike the established agencies, we at CountryRisk.io base our sovereign risk scores exclusively on quantitative analysis with no analyst discretion applied. We update the database that underpins our sovereign risk assessments whenever new data becomes available, which ensures that our Sovereign Risk Scores and related products, such as shadow ratings, are always current.
An important dataset that feeds our quantitative model becomes available every April and October when the International Monetary Fund (IMF) updates its World Economic Outlook (WEO). Starting with the April 2021 update, we’ll publish notes — of which this is the first — to explain the changes to our ratings triggered by the latest WEO.
The IMF’s updated view
Progress on vaccinations has led to increased optimism among IMF economists. As a result, the April 2021 WEO features a somewhat improved outlook for several economic indicators, especially around growth and public finances.
The IMF now expects global output to have shrunk a little less in 2020 than had previously been feared. It also now anticipates a stronger recovery, with the IMF increasing its prediction of a 2021 global economic expansion from just over 5% in October 2020 to 6% in its latest WEO. In addition, the update included a somewhat upgraded forecast for 2022.
And yet, as suggested by the title of this latest report — ‘Managing Divergent Recoveries’ — the IMF expects progress to be uneven, with advanced economies — especially the United States — mostly driving the improved outlook. In the US, unprecedented fiscal and monetary stimulus has led the IMF to more than double its growth expectations for this year to 6.4%. In contrast, emerging and developing countries (EMDEs) are making less headway. The poorest region, Sub-Saharan Africa, has seen its growth forecast for 2021 nudged up by only 0.3% this year and not at all for next year, versus an average forecast increase of 1.2% for 2021 and 0.7% for 2022 in developed countries. Worse, the IMF predicts this worrisome divergence to continue until at least 2024, when Sub-Saharan Africa will regain its pre-pandemic levels of GDP per capita in terms of purchasing power. And while a significant acceleration on the vaccination front could close the gap, there’s currently little to suggest that such an optimistic scenario is likely.
CountryRisk.io sovereign rating changes
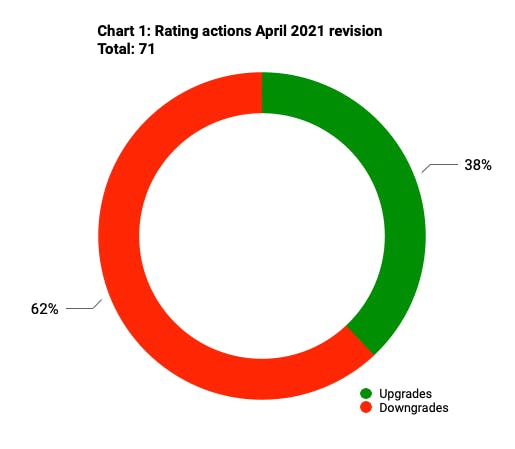
The April 2021 update of the WEO database (together with other data sources updated simultaneously) led to 71 sovereign rating changes, which covers over a third of the 190 countries included in our model. We consider this to be a relatively high ratio that reflects the extraordinarily volatile times in which we live. In such an environment, forecasts are also bound to be more volatile, leading to more rating changes than when the world economy is trundling along a steady path.
At CountryRisk.io, we see rating stability as a virtue. On this point, then, we agree with the ‘steady hand’ philosophy of established rating agencies. But we also believe that exceptional times can and, indeed, should see more rating changes than usual. Elsewhere, we’ve explained our position that, when it comes to sovereign ratings, the incumbent agencies’ reactions to the pandemic have been surprisingly mild, especially for advanced economies.
The CountryRisk.io Sovereign Risk Score ranges from 0 to 100, where 100 indicates the highest possible sovereign credit risk. To make our ratings more comparable with those of the traditional agencies, we also map the numerical score to one of the 20 conventional letter ratings, from AAA to CCC. This 20-notch scale is quite fine-grained. As such, it doesn’t take much change in the underlying indicators to move a country’s ‘rating’ to another bucket.
Of the 71 rating changes that followed the April data update, 62% were downgrades and 38% were upgrades (see Chart 1). This is a slight improvement on the Q1 ratio, when just 32% of rating changes were upgrades. But the balance remains negative.
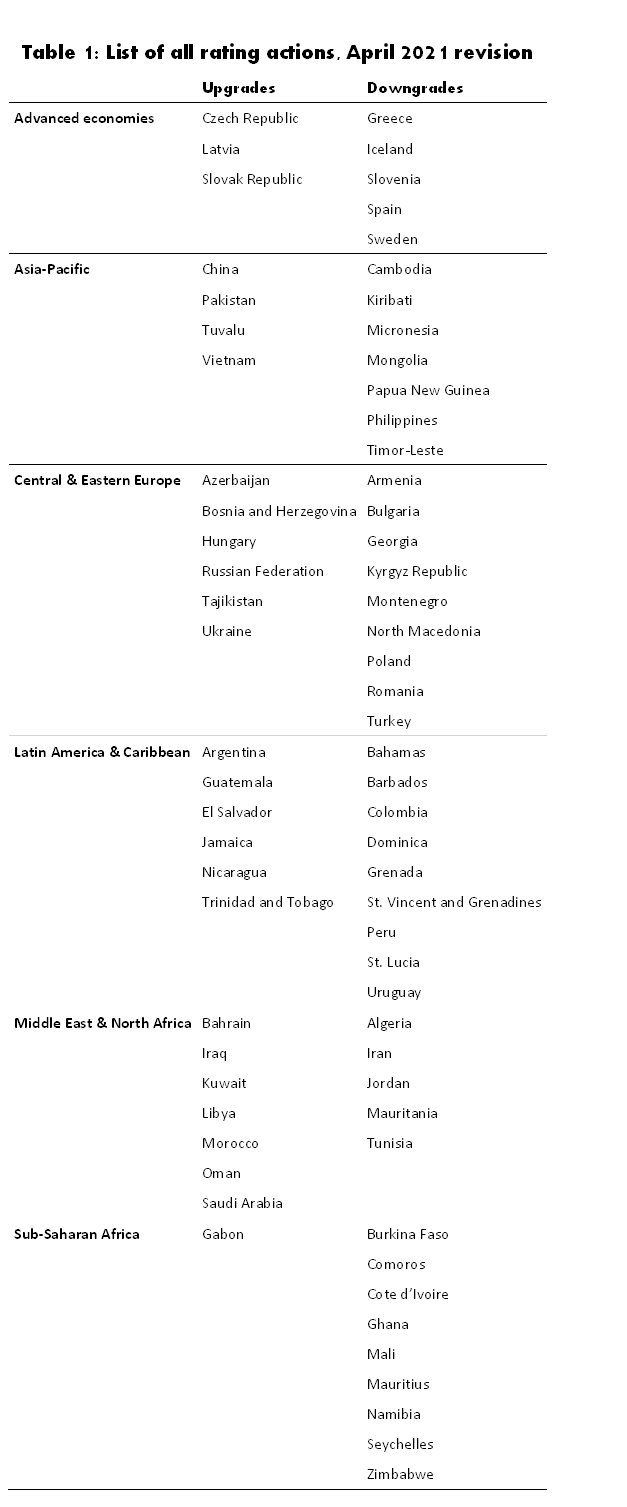
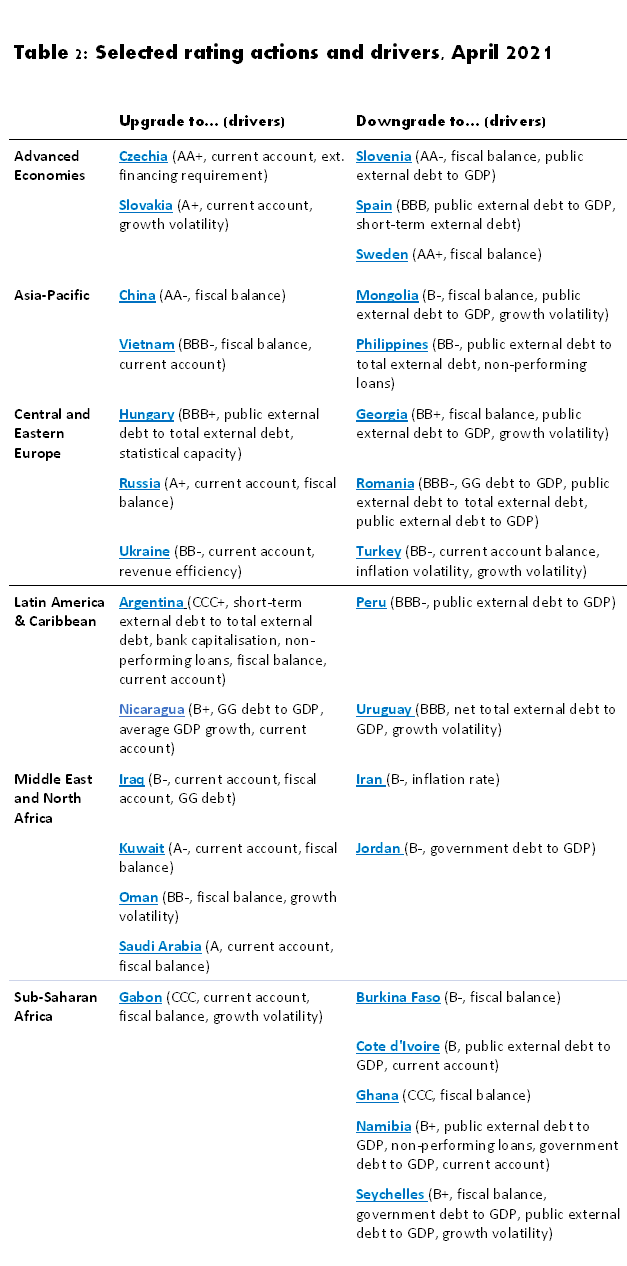
You can find a complete list of rating changes in Table 1. Table 2 highlights analytical triggers for selected sovereign rating actions.
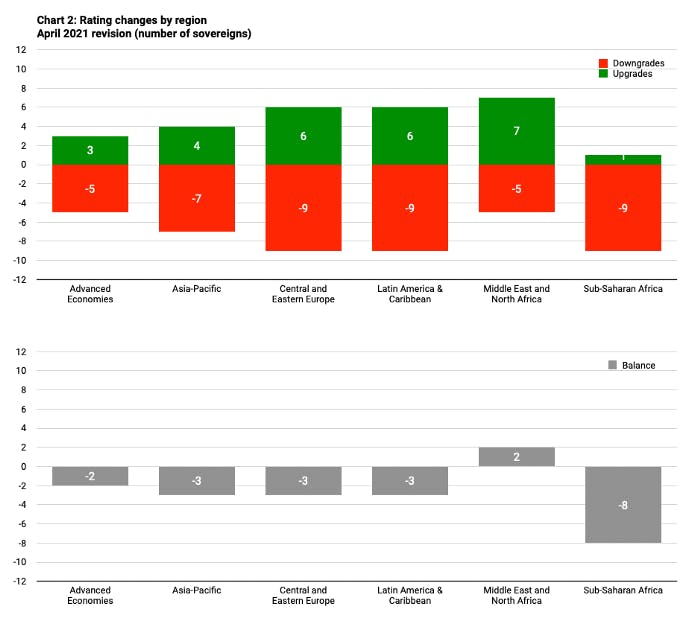
The only region with a positive rating action balance is the Middle East and North Africa (MENA) (see Chart 2), driven predominantly by improvements to the twin fiscal and current account deficits (see Table 2) in the oil-exporting Gulf nations. These improvements were caused by an improved forecast for the price of oil, at least for this year. Gulf Cooperation Council (GCC) members Bahrain, Kuwait, Oman and Saudi Arabia all saw an upgrade, as did non-GCC hydrocarbon producers Iraq and Libya. Still, the sovereign ratings of oil and gas producers remain significantly below their peaks. Meanwhile, MENA sovereigns that received downgrades are all oil importers except Iran, where inflation volatility was the decisive factor.
Sub-Saharan Africa (SSA) had the most negative change ratio. Here, only Gabon — another oil exporter — received an upgrade, though it remains mired in the CCC category. Weaker fiscal and government debt metrics were key drivers for most of the nine SSA downgrades, reinforcing concerns about mounting debt stress in the region.
The largest economy to enjoy a sovereign upgrade last month was China, which moved to AA- from A+. Thanks to a robust comeback from the lockdown-induced Q1 2020 recession, China’s budget deficit recovered more swiftly than expected, warranting an improvement in its sovereign risk.
In the group of advanced economies, Sweden’s rating fell to AA+ on weaker public finances, while Spain’s rating was cut to BBB due to gradually rising external leverage.
What moved the needles?
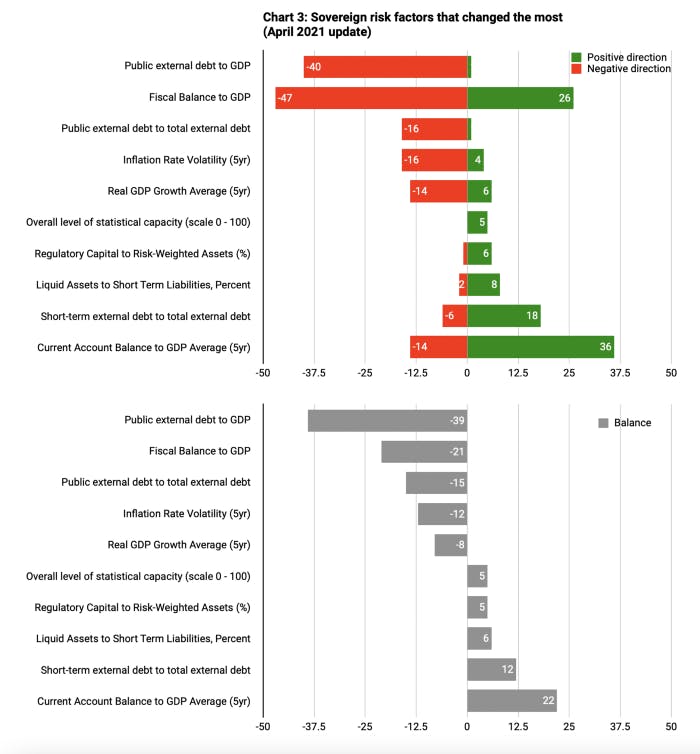
Chart 3 summarises the top five contributors to both upgrades and downgrades, which we base on an analysis of the variables included in our model for all sovereigns. Here, we look at which predefined indicator threshold breaches led to changes in their respective risk scores, which, in turn, could trigger a rating change. However, it’s important to remember that rating changes are often the result not of a combination of indicators (see Table 2 for examples).
Most of the factors putting negative pressure on ratings (see the top rows of Chart 3) are related to public finances.
‘Public external debt to GDP’ was the top negative variable as well as the most one-directional: 40 sovereigns saw a negative threshold breach for this variable, with just one — Sri Lanka — enjoying a positive breach.
With a net 21 negative breaches, fiscal balance was the second biggest contributor to downgrades (see lower panel of Chart 3). That said, there were also over two dozen positive threshold breaches for this indicator, including — as noted earlier — for those sovereigns that are oil exporters (see upper panel of Chart 3).
The most significant contributors to upgrades — those indicators that saw more positive than negative threshold breaches — tended to reflect external factors, such as the current account balance and external liquidity metrics.
This welcome development may reflect a somewhat faster- and stronger-than-expected recovery of the world economy and trade from the deep slump of 2020. Encouragingly, banking system solvency also improved in a handful of countries, as credit risks in the financial sector remain manageable in most systems.