How we’ve changed our Sovereign Risk Score Methodology
At CountryRisk.io, we aim to give you the tools you need to carry out your own due diligence on country and sovereign risk.

Bernhard Obenhuber
Jan 03, 2022
At CountryRisk.io, we aim to give you the tools you need to carry out your own due diligence on country and sovereign risk. We do this by providing you with curated statistical data, selected reports from respected sources, and a range of rigorous quantitative models through a powerful, easy-to-use interface.
When it comes to using our quantitative models, we suggest two distinct approaches:
- Our Sovereign Risk Scores are ideal for consistently and efficiently monitoring a large set of countries.
- Our Sovereign Rating Model enables you to conduct a deep dive on a specific country through a range of quantitative and qualitative risk factors that deliver a thorough understanding of the sovereign’s characteristics and associated risks.
As part of our model governance process, we regularly reflect on and review the underlying methodologies in light of new information (e.g. the integration of environmental and social risk factors), lessons learned (e.g. the European sovereign crisis), or advances in quantitative methods (e.g. machine-learning algorithms).
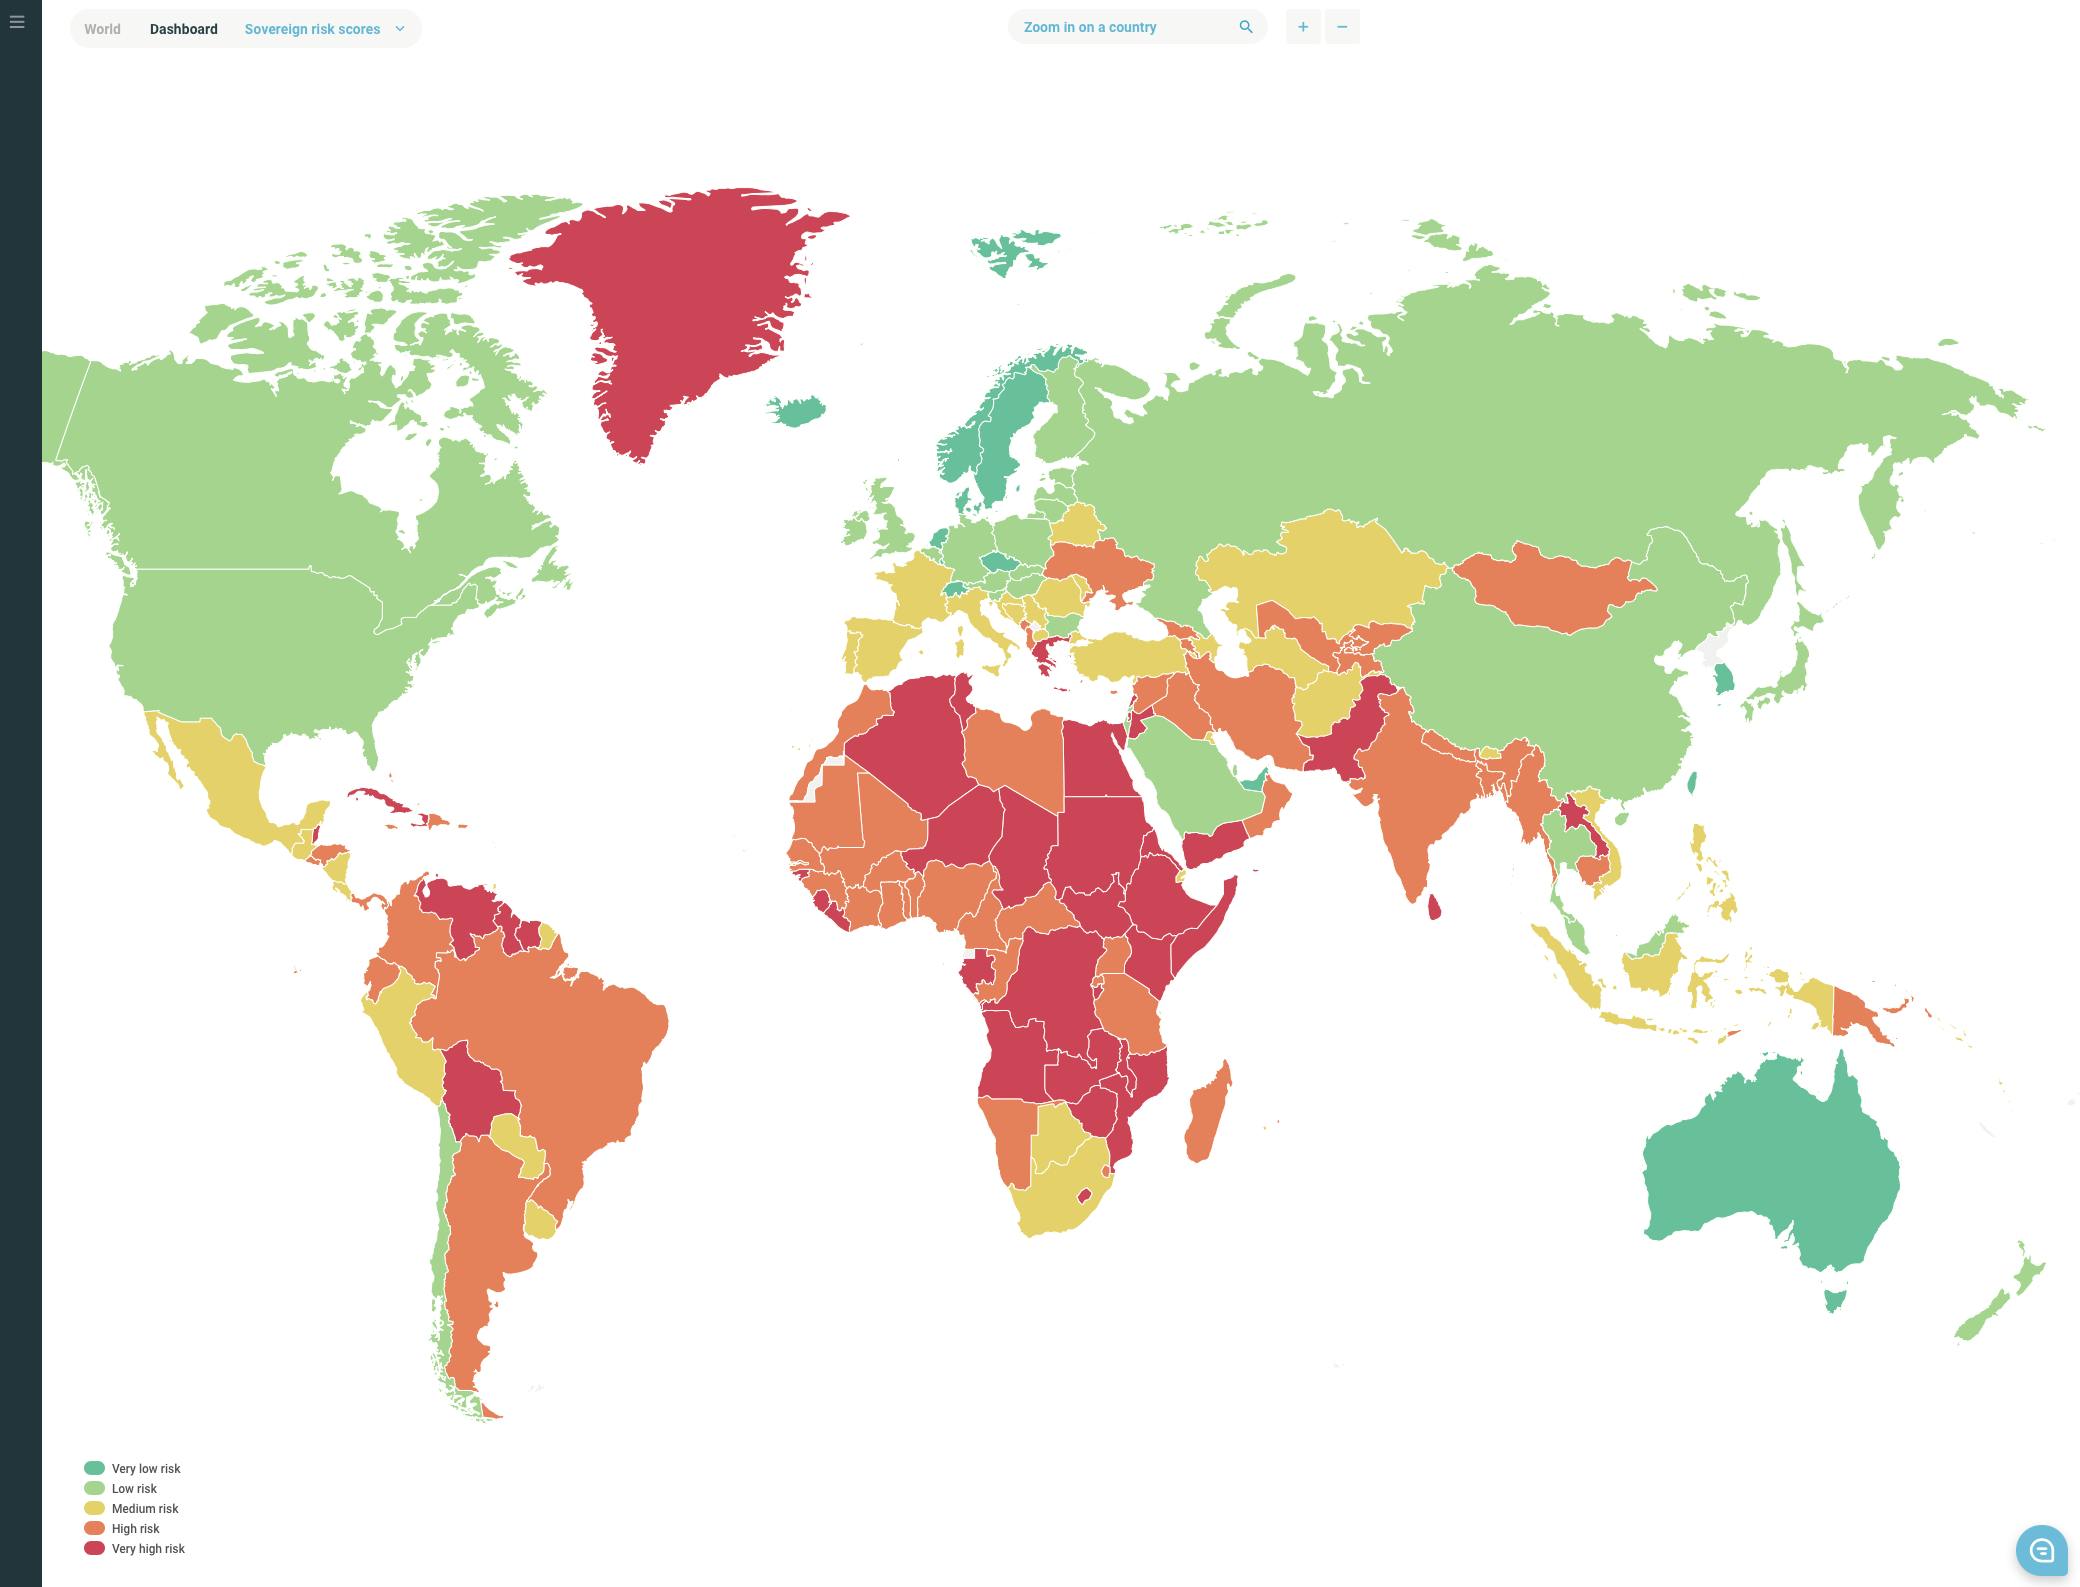
In this blog post, we’ll discuss CountryRisk.io’s updated framework for determining our Sovereign Risk Scores—each of which indicates the level of sovereign credit risk for a given country—and why we made these changes. Like our Sovereign Rating Model, our scores focus strictly on sovereign governments at a national level, excluding regional governments and quasi-sovereign entities.
The objective of our Sovereign Risk Scores is to classify countries according to their willingness and ability to honour foreign currency government bond obligations. We convert our risk scores into the letter ratings used by the Big Three agencies using a static convergence table and without applying any qualitative judgment, so you can easily compare our scores with their ratings. Unlike rating agencies, we don’t declare defaults or distressed restructurings. Since our aim is to assess and compare credit fundamentals, our letter conversions don’t include a default ‘rating’.
What’s new
Our updated CountyRisk.io Sovereign Risk Scores and underlying methodology differ in two significant ways from our previous version.
First, the new version adopts a longer time horizon to deliver scores that are less cyclical and volatile. We did this by applying multi-year averages to the underlying data.
Second, this version has fewer risk sections and underlying indicators than the previous model, which makes assessing a sovereign’s willingness and ability to honour its obligations simpler and more efficient.
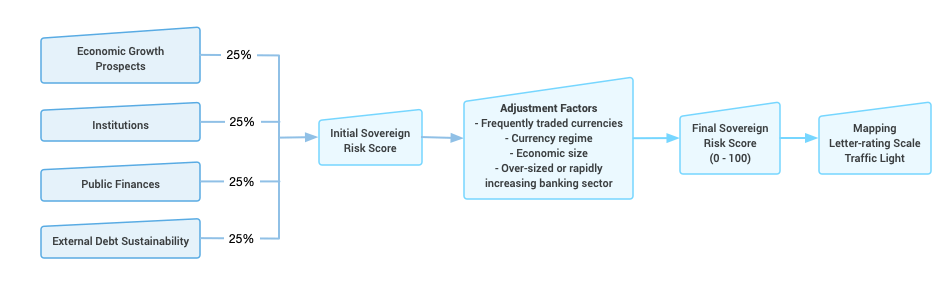
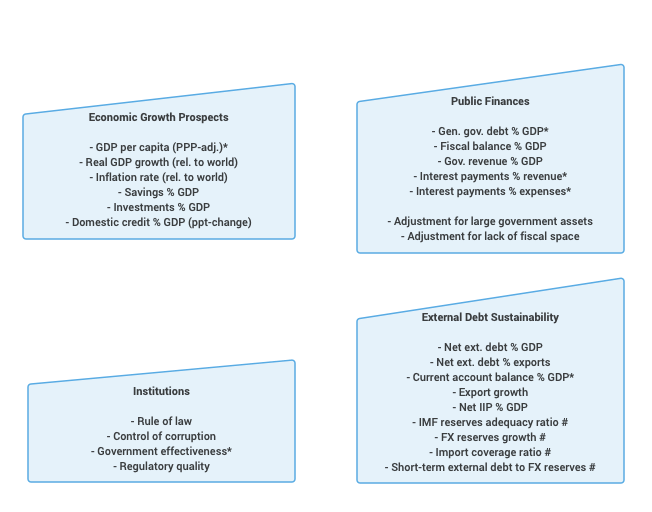
We want our risk scores to emerge from a glass box, not a black one. So, as with the previous version, we only determine our Sovereign Risk Scores using publicly available quantitative indicators. We apply no analytical discretion or qualitative judgement to the model’s output. Figure 1 (below) shows the overall structure of the model and lists the individual indicators for each of the four sections.
You can find a detailed description of the methodology here (Link).
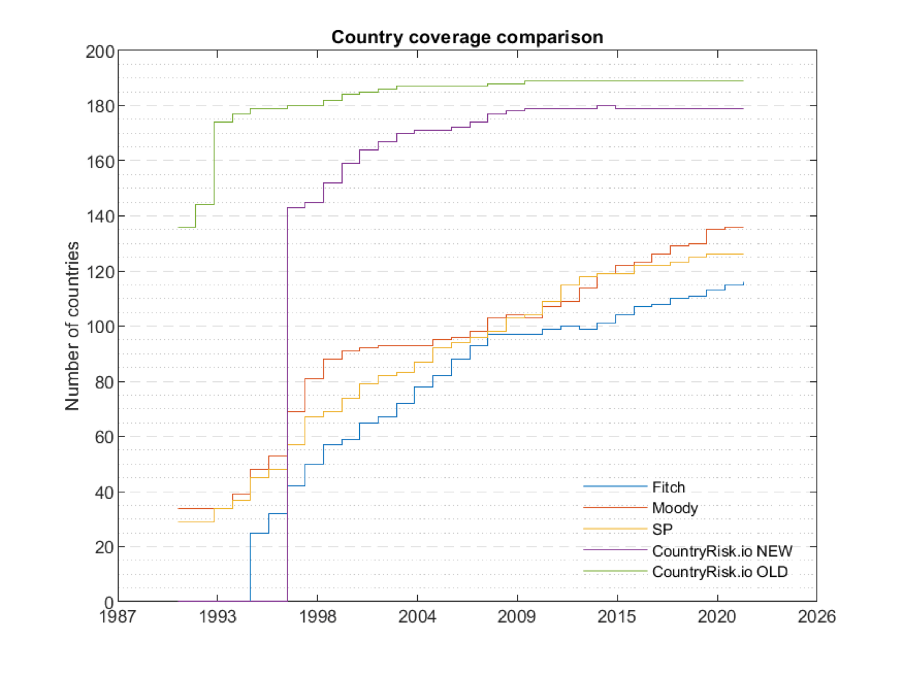
Broad country coverage
In this version, we’ve also slightly raised the bar around required minimum data availability, leading to a marginal decrease in our country coverage. Nevertheless, our Sovereign Risk Scores still include around 180 countries, which, as shown in the figure below, continues to represent an extremely expansive level of coverage.
Reduced volatility
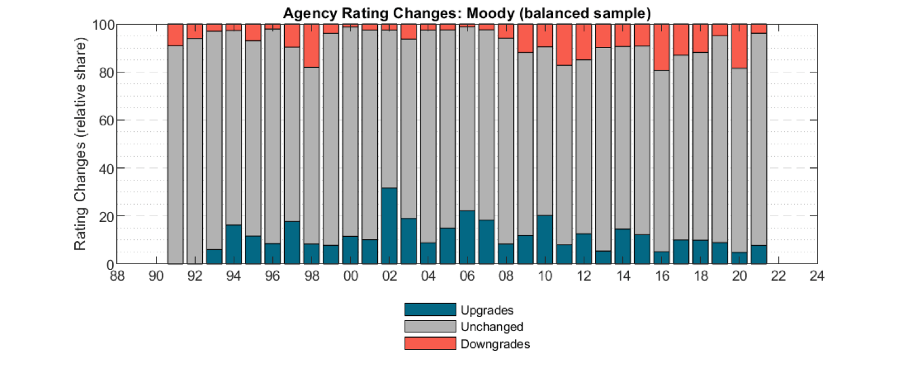
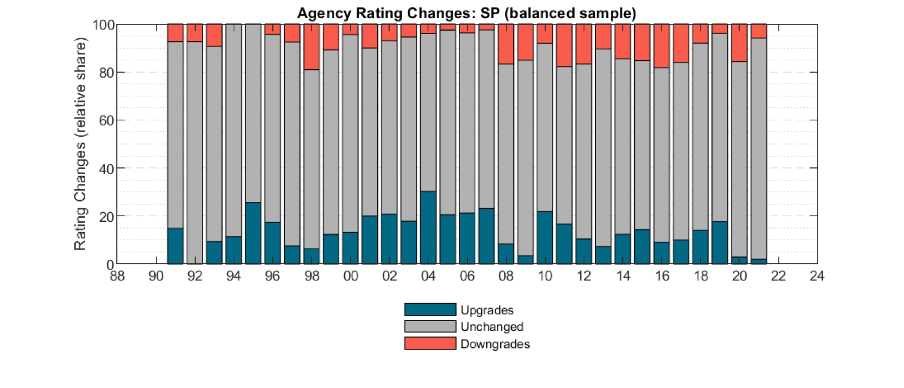
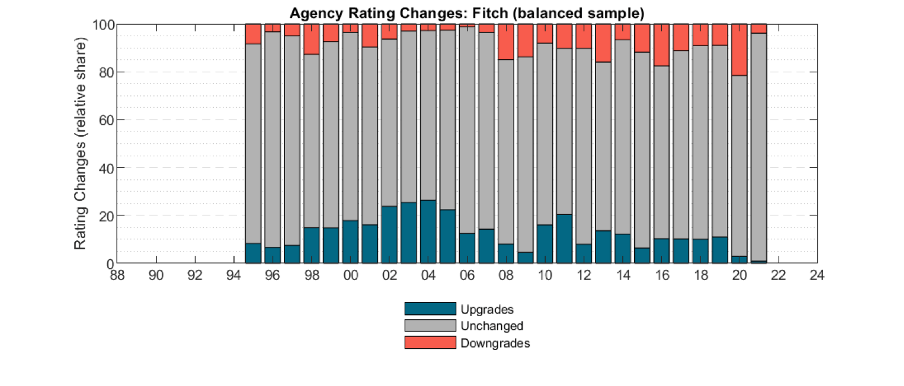
As we discussed earlier, reducing the volatility of our scores by lengthening our time horizon to bring it more in line with that of the Big Three agencies was a key motivation for the methodology revision. The previous version of our methodology often delivered volatile scores during crisis years, such as the great financial crisis in 2008 or the first pandemic year of 2020. The first chart in the panel below shows the yearly proportions of upgrades, downgrades and unchanged ratings produced by the previous version of our methodology, and clearly illustrates the volatility of our ratings during years of crisis. In contrast, the second chart, which shows the rating changes that our revised methodology would have produced, exhibits far less volatility even in crisis years.
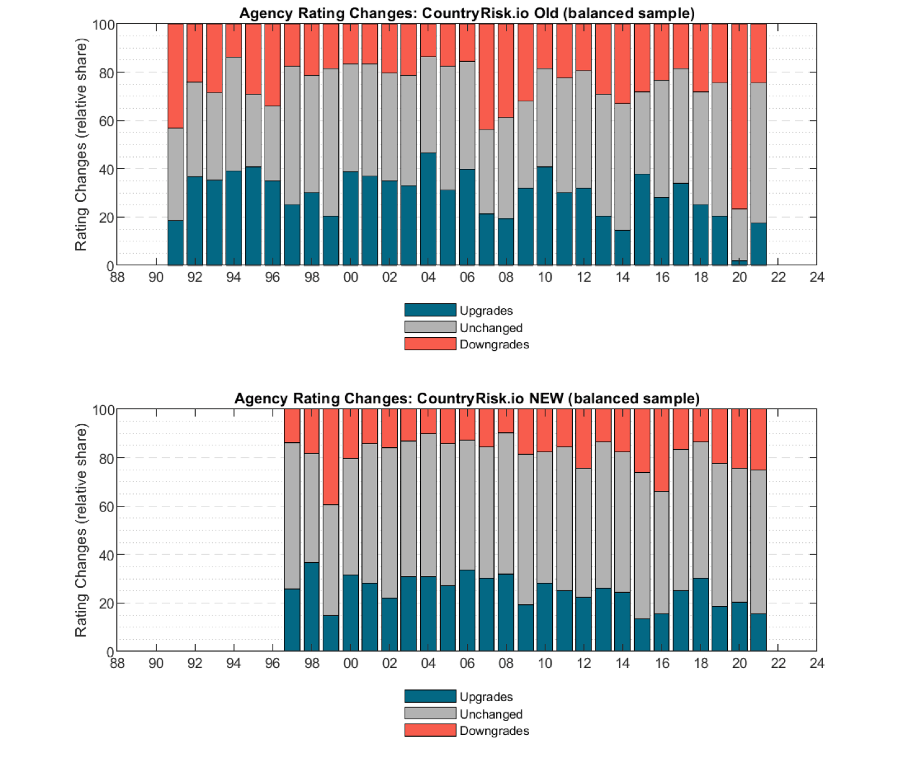
Although the updated methodology will make our Sovereign Risk Scores more sticky, they will still react more quickly to changing data than the ratings of the Big Three agencies.
Rating distribution compared to the Big Three
The Sovereign Risk Score is a number between 0 and 100, with higher values indicating greater sovereign credit risk. The chart below shows how each score compares with the average rating of the Big Three. While there’s clearly a strong correlation, our Sovereign Risk Scores also differ in many cases. You can explore the similarities and differences for yourself on our Insights Platform.
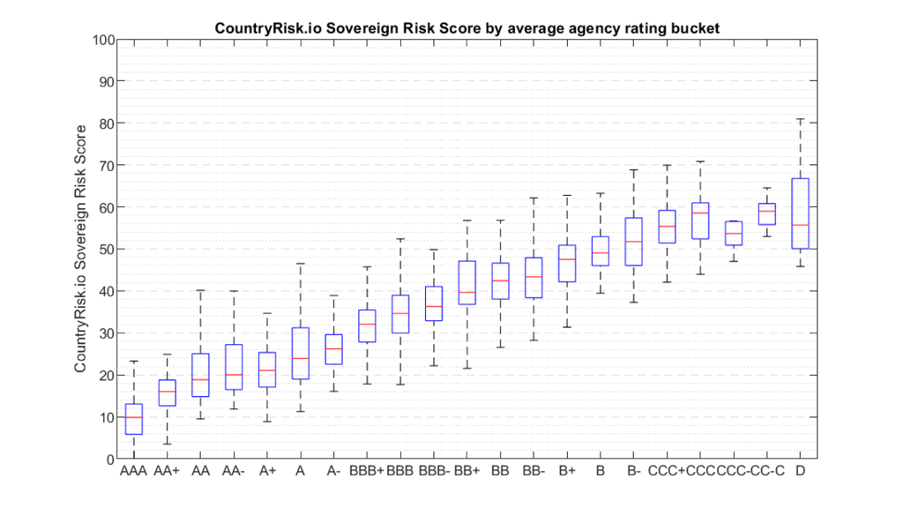
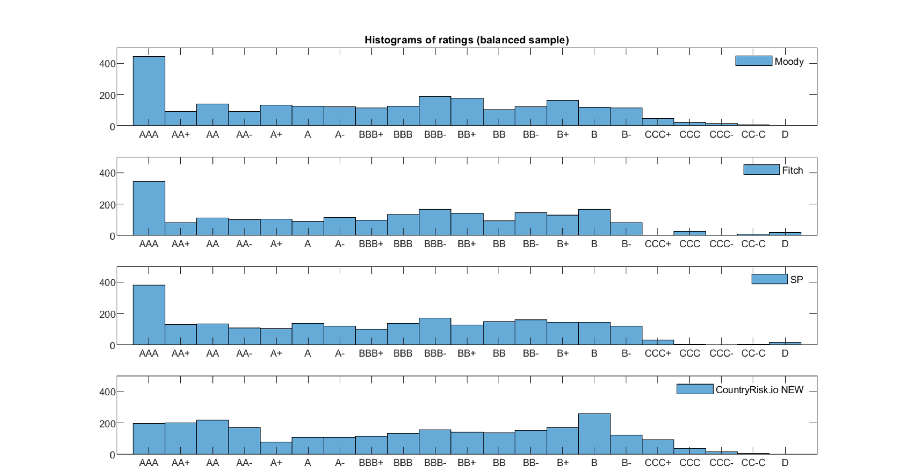
Purely for ease of comparison, we map our numerical scores to the widely recognised AAA – CC letter ratings, which highlights the points of ‘(dis)agreement’ between the Big Three’s ratings and our scores. There are two main divergences in our new methodology, which places: 1.) fewer sovereigns in the AAA bucket; and 2.) more countries in a broader range of the highest risk buckets.
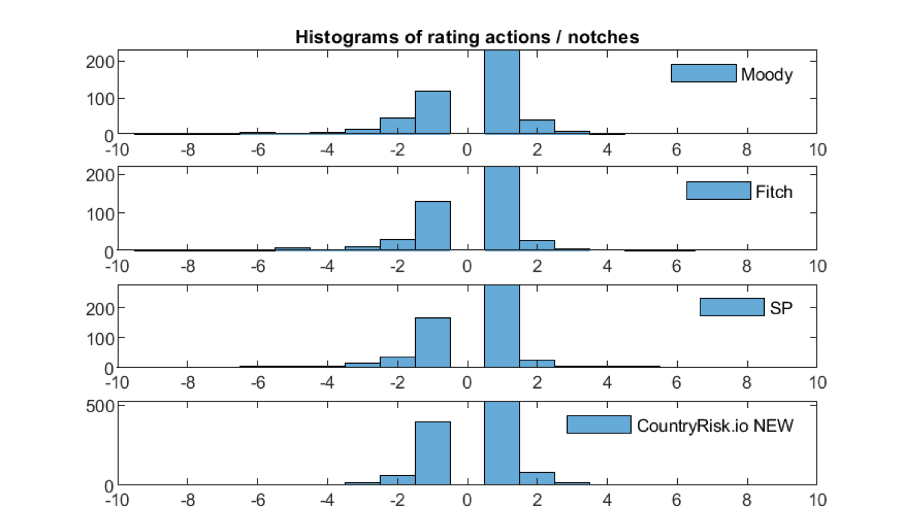
An interesting picture emerges when we compare the Big Three’s annual rating changes with the mapped CountryRisk.io scores, as shown in the panel below (we removed the unchanged observations from the histogram to improve the charts’ readability). Unsurprisingly, one-notch upgrades and downgrades are dominant and, as we don’t apply any manual adjustments to the quantitative results, our scores change far more often than the Big Three’s ratings. The chart also shows that our methodology rarely yields significant multi-notch changes, in contrast to several instances of multi-notch downgrades from the Big Three. We plan to publish a separate blog post on this interesting feature of our Sovereign Risk Scores.
What’s next?
We’ve now been testing and scrutinising these changes for several months. As such, the new methodology and results will be ready for release with the next data update at the end of January. You’ll find the new scores on the CountryRisk.io Insights platform.
As always, we rely on input from our community as we strive to make CountryRisk.io the best it can be. So, if you want to know more about the nitty-gritty details of our updated methodology, or you have any ideas for how we can improve our model, please do get in touch to arrange a conversation with one of our experts. Just click here to choose a convenient date and time, and we’ll get back to you as soon as we can.