Green bonds and environmental outcomes — a mixed picture and a new approach

Bernhard Obenhuber
Oct 19, 2020

The green bond market passed its latest milestone in October, with more than $1 trillion issued since the market’s emergence in 2007. But new research has raised questions over whether corporate green bonds are materially contributing to the low-carbon transition, inviting scrutiny of the impact of sovereign green bond issuance.
Green bonds are debt instruments whose proceeds typically are ringfenced for specific green projects, often to address climate change and carbon emissions. The Bank for International Settlements (BIS) — the international body which acts as the bank for central banks — examined the extent to which companies that have issued green bonds have subsequently reduced emissions, measured in terms of their carbon intensity (the ratio of carbon emissions to revenue).
The BIS looked at the issuance of green bonds as captured by the four main providers of green bond data and compared that issuance to annual corporate carbon emissions data collected by S&P Trucost.
“Overall, there is no strong evidence that green bond issuance is associated with any reduction in carbon intensities over time at the firm level,” the BIS said in anarticlein its recentBIS Quarterly Review.
It added that the results didn’t imply that projects financed by those green bonds didn’t reduce emissions — but rather that issuance didn’t correlate with lower emissions at the firm level.
The authors used this finding to advocate for a complementary rating system for companies to encourage firms to improve their carbon efficiency. But it also begs the question as to whether the issuance of green bonds by sovereign issuers has any read-across to national environmental performance.
Methodology applied to sovereigns
The BIS paper offers some interesting insights and conceptional approaches that we wanted to apply to sovereigns. As a first step, we calculated some CO2 intensity measures based on IEA data that, unfortunately, only runs to the end of 2017. However, for the purposes of this article, we are more interested in the approach than having the latest data.
We define a sovereign’s carbon intensity as the CO2 emissions in kg per GDP (in 2010 US dollars and on a purchasing power parity (PPP)-adjusted basis). We are aware of the challenges of working with country specific CO2 emissions (e.g. carbon leakage as we wrote in an earlier blog post).
Secondly, we calculated the percentile distribution of carbon intensity across all countries and available years. The chart below shows that 25% of countries have a carbon intensity of around 0.13kg per unit of GDP and some countries have a multiple of that. For illustration purposes, we included the carbon intensity of three countries and where they fit on the curve. Denmark’s 2017 carbon intensity places the country in a positive area of the curve while Saudi Arabia is on the other end of the spectrum.
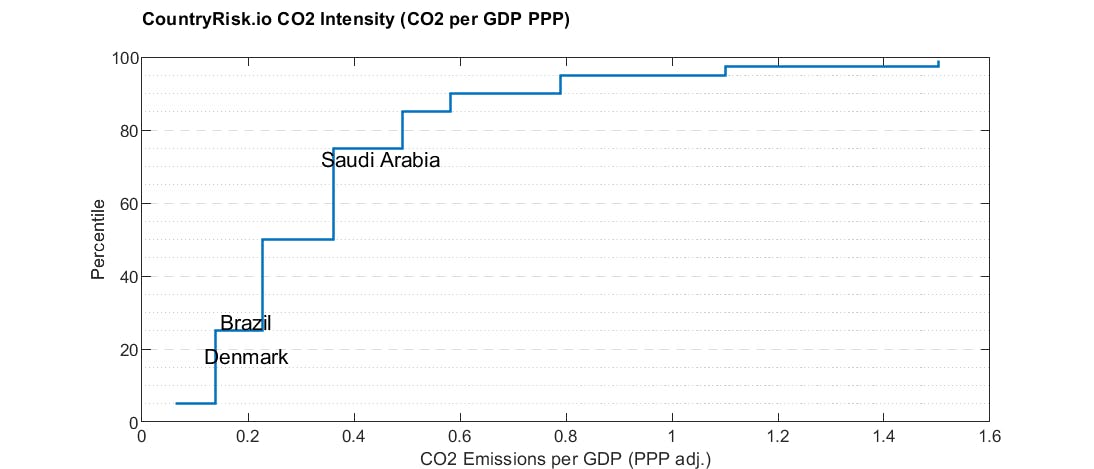
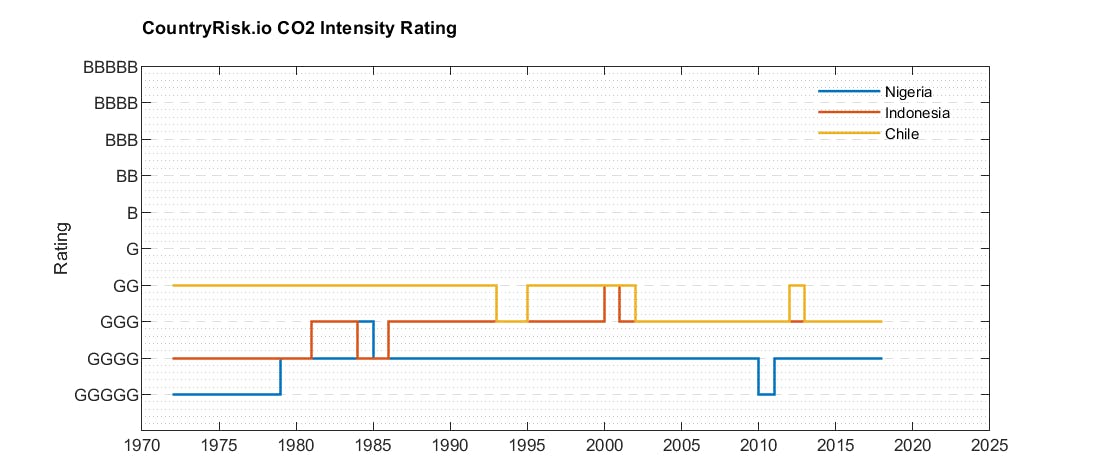
Similarly to the BIS paper, we take the percentiles of carbon intensity to assign a carbon intensity rating to the country. Choosing ‘B’ for brown and ‘G’ for green, the rating ranges from BBBBB for the highest intensity to GGGGG for the lowest.
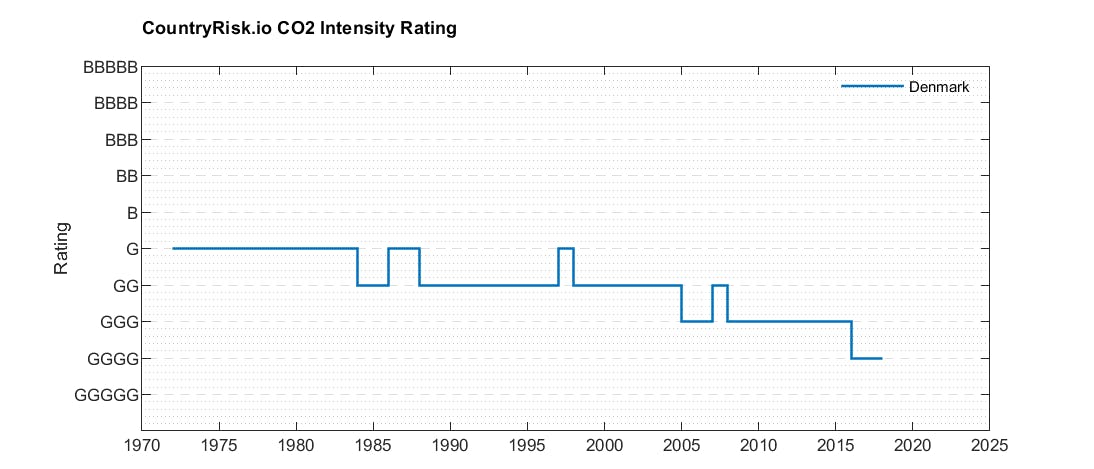
Looking at Denmark, the country started with a G rating in the early 1970s and continuously improved over time to GGGG, the second highest rating. As said, one needs to take such carbon intensity ratings with a grain of salt as Denmark might have simply outsourced high-emitting production to other countries. So, a better rating measure might be one that is the average of carbon intensity based on both consumption and production-based emissions — this is something we will consider in a future update.
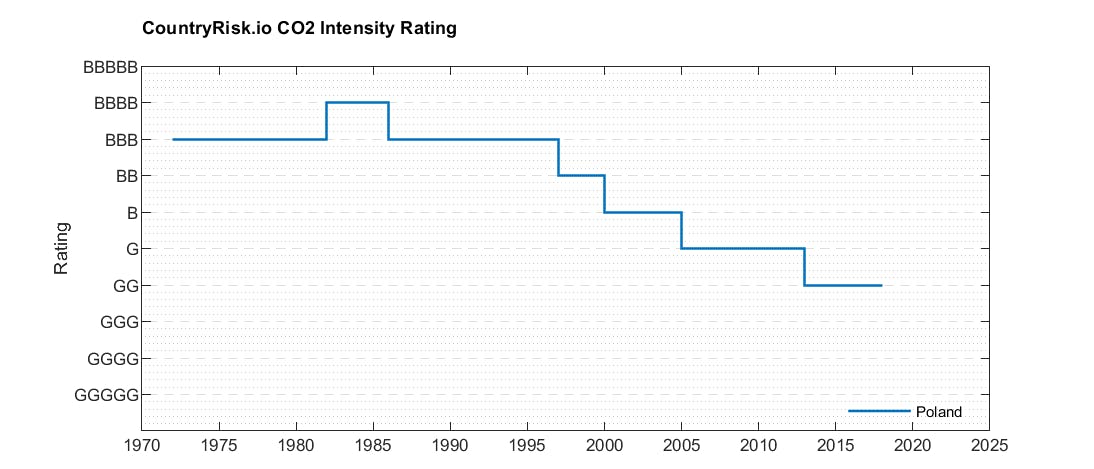
Poland provides an interesting example. The country had a very poor rating in the 1970s because of the dominance of heavy industry, but it has improved significantly over time as other (service) sectors have accounted for an increasing proportion of its economic output.
Armed with the ratings for 140 countries and over more than 40 years, we can also calculate how likely it is for a country to transition from one rating to another. Over a one-year horizon, a country’s carbon intensity rating is unlikely to change. However, over a three-year horizon, the numbers become more interesting to look at.

For example, if a country has a G rating to begin with, there is a 65% chance that it will stay a G country over a three-year period, a 26% chance that it improves to GG and a 6% chance that it will deteriorate to B.
Sovereign issuers of green bonds — a diverse group
So how might these ratings relate to green bond issuance? Certainly, at first glance, there appears to be little that unites sovereign issuers. According to data from the Climate Bonds Initiative, green bond issuers include Poland, which issued the first green sovereign in 2016, Fiji, Nigeria, Indonesia, Belgium, Chile and the Seychelles. This year, Germany tapped the market for the first time, as did Sweden.
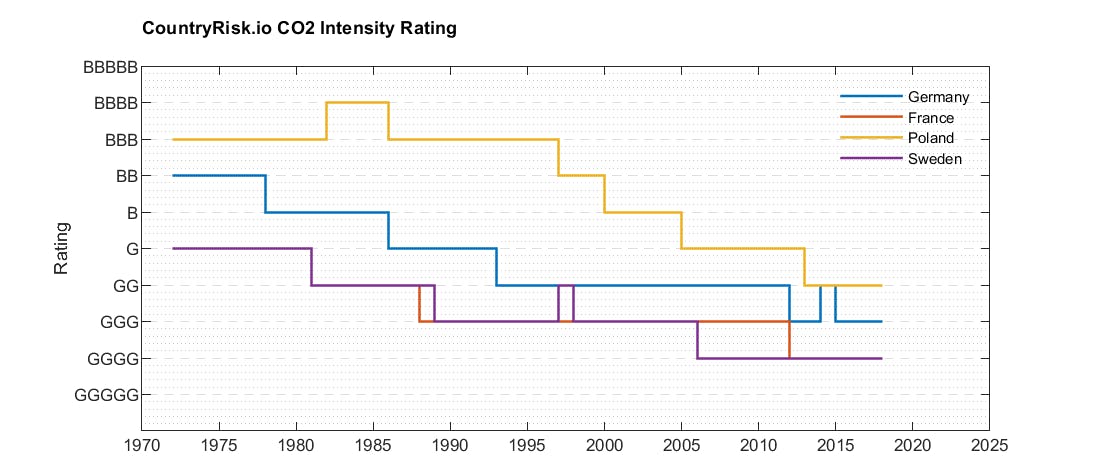
Among issuers, Germany, Sweden and France might be considered leaders in terms of environmental policy and performance. Poland’s government, conversely, has resisted EU climate policy and has sought to shore up its large coal sector. Nevertheless, on the proposed and perhaps oversimplified measure, Poland’s rating has nearly converged with the other European countries. Further upgrades, however, will require significant efforts by the Polish government that do not seem to be on the political agenda currently.
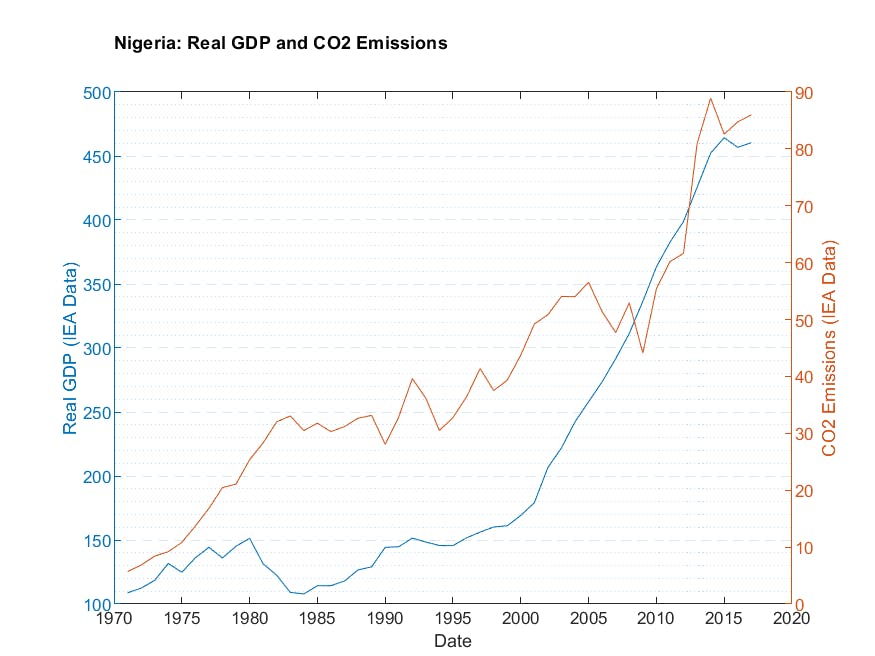
Working with the numbers on emissions and carbon intensity also forces one to confront some preconceptions on countries with hard facts. For example, Nigeria and Indonesia appear to be laggards because of their large commodity sectors, but the numbers relating to carbon intensity ratings suggest otherwise.
Admittedly, the PPP adjustment of the GDP denominator helps in this calculation and it will be increasingly difficult for such countries to maintain such good ratings unless there is a decoupling of economic activity and CO2 emissions (see chart below).
Sovereign risk analysis 2.0
It is perhaps a stretch to expect that sovereign green bond issuance would be determinate of a country’s overall environmental performance, and there is too little data to conduct a solid analysis. But there are likely to be benefits to sovereign issuance that, if not readily quantifiable, are nonetheless real.
Green bond issuance attracts interest in and scrutiny of a government’s overall environmental performance — especially in these early years of the market, when sovereign issuers are relatively rare. This is likely to encourage improved environmental policies and performance, at least on the margin.
In addition, green bond issuance forces asset managers to spend time and analyse a sovereign’s environmental policies and performance. We are encouraged that the financial industry is gradually moving away from using third-party ESG ratings as a figleaf and is undertaking proper ESG due diligence as part of standard debt sustainability analyses.
We at CountryRisk.io expect that we are not far away from a situation where ratios such as carbon intensity, biodiversity loss vulnerability and other sustainability ratios will stand side by side with government debt ratios or reserve adequacy ratios.