Breaking the Data Wrangler’s Code: Our Data’s Biggest Secrets Finally Revealed
In this blog post, we share the details of the data pipeline used for CountryData.io.

Bernhard Obenhuber
Oct 16, 2023

As you might have gathered from the overenthusiastic title and the dated cultural reference therein, at CountryRisk.io, we love data. And we’re honoured that, every day, thousands of you trust our data to inform your country risk decisions.
We don’t take that trust for granted. After all, for all practical purposes, data quality always falls to the level of their credibility. And, as intermediaries, we understand that you can’t trust our data unless you can also trust that the processing we must do between acquiring it and making it available on our platform preserves the data’s original meaning and, more generally, that we follow stringent data governance practices.
In other words: we recognise that, if our data is to be credible, it also needs to be transparent. And as we recently launched our new dedicated data platform, CountryData.io (which we introduced here), now seems like an opportune moment to explain how our particular data sausage gets made.
Source data types
Some source data need more processing than others. For our purposes, we differentiate between three types of source data:
Structured data
Structured data is already well formatted, machine-readable, and standardised, which often means it’s linked to ISO country codes or date formats so they can be integrated into an API. While API access usually also requires us to map the source data’s attributes to our internal data structure, processing structured data is far less labour-intensive than the next two categories.
Semi-structured data
Some data come in a structured format, such as a spreadsheet or HTML table, that can be easily parsed by code. However, the data itself might be presented in non-standard ways, like using country names instead of ISO country codes. Worse, the data provider might change that structured format over time. For each semi-structured data source, then, we must write a specific parser and update it whenever the data format changes.
Unstructured data
These data are often found buried in long PDF reports or on a web page amongst reams of text and badly formatted tables. And unstructured data are rarely found in the same place, or presented in the same way, twice. As such, this is the most difficult type of data to process as they require the most human intervention, either because the parsing needs to be comprehensive or, in the worst case, can only be done manually. That said, data often come in an unstructured format when they’re saying something particularly insightful, which means the most difficult processing often produces especially valuable data.
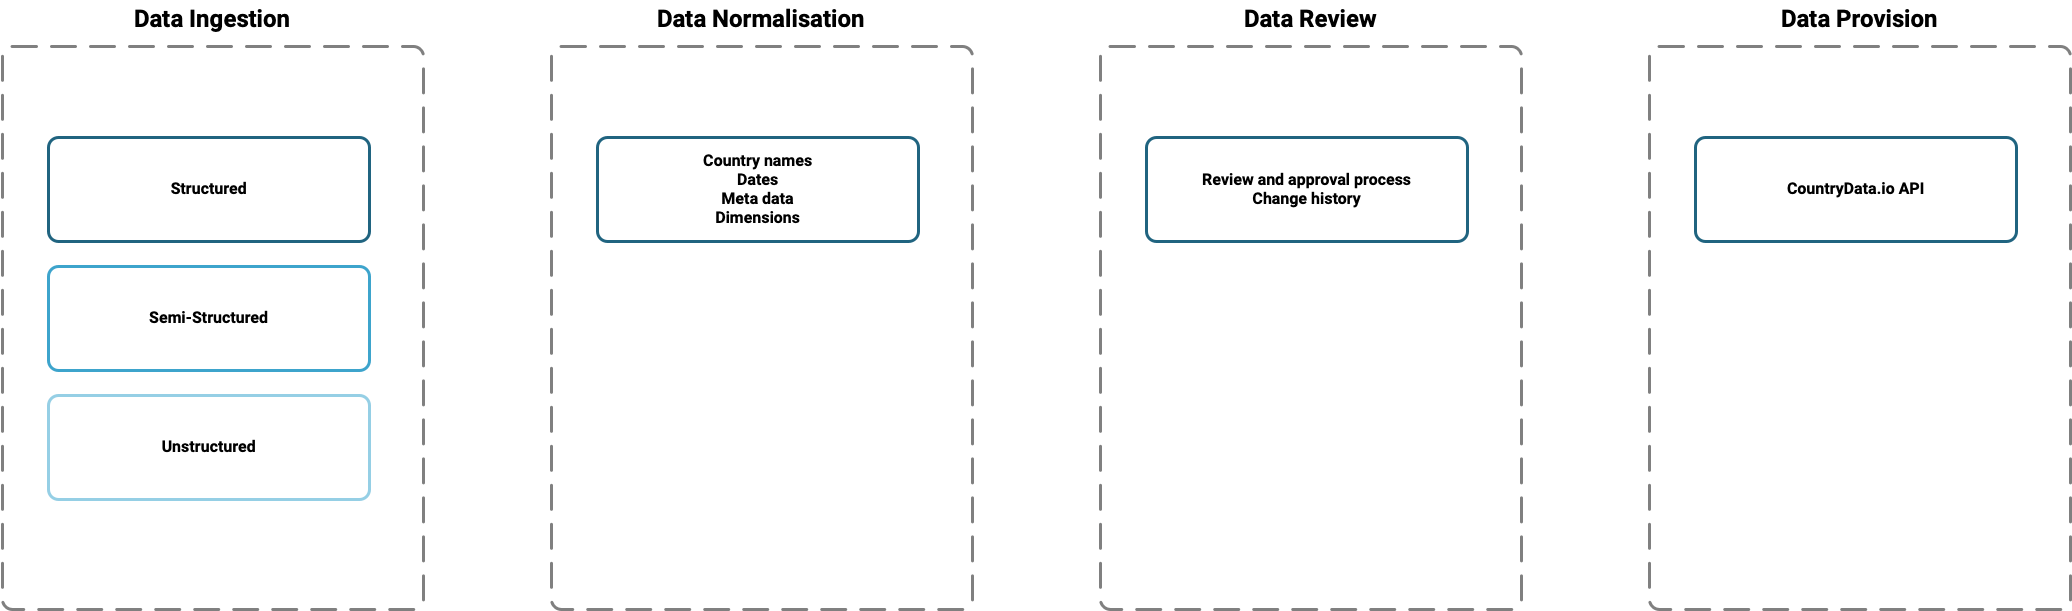
Data standardisation
No matter what state the data are in when we receive them, they must be presented consistently if they’re to be used for analysis or to create comparative visualisations—whether by human or computer.
Before our data reaches the CountryData.io database, we apply four primary structural levels:
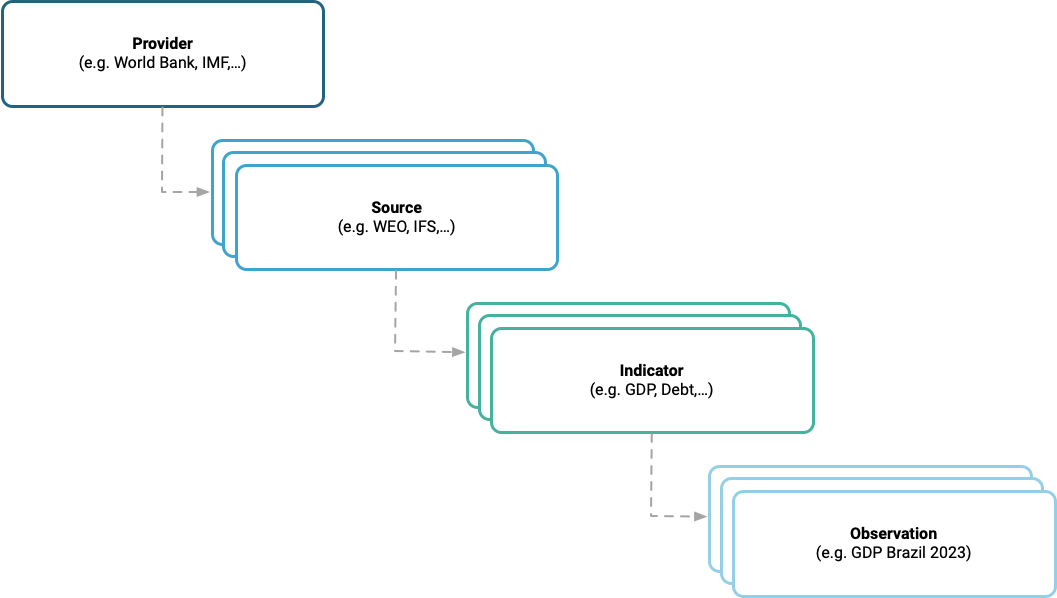
Each of these four levels has its own range of metadata:
Provider
The top layer names our data provider (e.g. World Bank), along with any third-party provider (e.g., FAO) where ours is itself an intermediary. For each provider, we store just a few attributes: Name, Description, Main URL, and an Internal comment.
Source
Some providers have multiple data collections, such as the International Monetary Fund, which provides the World Economic Outlook database, the Financial Development Index, and many others. So, the second level, Source, identifies which of the provider’s collections the data come from. And, for each Source, we capture a range of metadata:
- Provider
- Name of source
- Manual import (Boolean, if a manual data entry is allowed).
- URL: A link to the source; either the API endpoint, or the spreadsheet that needs to be parsed.
- API Key (if needed for source API access).
- Update schedule for the automated data import (e.g. every Thursday, 1st of the month, daily).
- License information: Whether the source data can be made publicly available
- Review required: Whether the source data needs to be reviewed by a human before final database storage. This will be the case for most semi-structured or unstructured sources. Meanwhile, structured data that’s updated very frequently from a tested API might not need a review.
- Date format and Date description for the source data: Such information might include an ISO 8601 format or year range (for multi-period survey data), fiscal year data (where different to the calendar year), and several other formats.
- Source indicators: If we access source data via an API, we can define a list of indicators that we’re interested so we don’t have to fetch the entire dataset.
- Source dimensions are vital to data standardisation, as they enable us to express the various dimensions a source has provided for a specific indicator. For example, the UN provides Sustainable Development Goals (SDG) data for indicators like primary school enrolment ratio. However, alongside the overall number for each country and year, the UN also breaks these numbers down according to factors like gender. In this case, Gender is a data dimension where the dimension is a categorical field with three allowed values: Total, Male, or Female.
- Some data even have multiple dimensions (e.g. Age group or Location (e.g. Total, Urban, Rural)). A dimension might also be a different way to express the value of the indicator (e.g. Rank). By using source dimensions, then, we can describe our data consistently and succinctly without the need for duplicate indicators for each dimension, such as multiple suffixes.
- Source tags are keywords that describe the data collection.
API data access permissions are set at the source level. So, if you have access to a specific source, then you have access to all its associated indicators.
Indicator
The third level describes a specific indicator (e.g., GDP per capita or FATF country black list). This is, arguably, the most important layer, as it refers to the specific metric we want to work with in our decision-making.
Accordingly, we have quite a long list of attributes for each indicator. In deciding which metadata to include, we looked to the World Bank’s metadata structure for inspiration, modifying it where necessary to suit our own needs and data types:
- Source
- Code (either alphanumeric or purely numeric)
- Short name and Long name of the indicator
- Short description
- Long description
- Indicator Tags
- URL (to the provider or source)
- Methodology URL
- Comment field
- Unit (e.g., CO2 per unit of GDP)
- Multiplier (e.g., Million or Billion)
- Statistical concept/methodology, Development relevance, Limitations, and Exceptions
- Currency (e.g., USD)
- Type (e.g., Numeric, Text, Boolean, Categorical) and allowed categorical value choices
- A Flag to signal where the indicator metadata are protected and must not be changed during an automated import.
Observation
The bottom layer is the actual observation value itself (e.g., GDP per capita for a specific country and date is “10,000 USD”). Here, we only need a few attributes:
- Country name and ISO code
- Indicator name and code
- Date
- Value
- Dimension key-value pairs
Data governance
We focus on three aspects of data governance:
Data coverage management
As many of our readers will know from experience, our love of data has a downside: the urge to hoard any and all data just in case it becomes useful… at some point.
For CountryData.io, we consciously fight this urge in order to prioritise quality over quantity. Before we add any new data source, we challenge ourselves on its relevance to country risk analysis and assess the data quality and cost of onboarding—such as parser development and maintenance costs over time—to ensure that all our data adds value.
Data update review & approval process
For most sources, any updates need to go through a review & approval process before the data are added to our platform. Crucially, our system does not allow the reviewer (i.e., the person who either triggers the update process for a (semi-)structured source or manually updates data from an unstructured source) to be the same person as the approver.
To make the reviewer’s life easier, the system also compares the new data to the old and highlights the following:
- Number of new indicators.
- Number of new observations (where new data are available).
- Number of changed observations (where previous data are revised).
- Information on duplicate observations (which can indicate a data problem at the source).
- Whether the source contains a country that doesn’t appear in our database.
Box: The pain of country names
Some sources use country names instead of standardised country codes. This can make data processing challenging because different providers use different naming conventions for each country, many of which have multiple accepted names that are often nearly identical. And while it might be obvious to humans that Cote d'Ivoire, Cote dIvoire, Côte d’Ivoire, and Ivory Coast all refer to the same country, a machine will assume that each refers to a different country unless you—somehow—tell it otherwise.
Which is exactly what we do. Whenever the system highlights a country name in a new dataset that isn’t already in our database, we “tell” it which country the new name refers to by adding it as an alternative spelling to the existing entry. This ensures that the new data will be correctly mapped during the next platform update.
We also do something similar for country codes. Although these are usually much more standardised than country names, some countries still have multiple codes associated with them, like RKS, KOS, XKX, or XXK for Kosovo.
Data traceability
Each of the four layers includes an audit trail that documents any changes the data, such when each observation was added to the database. An import job ID shows us when each value was changed and allows us to trace which users added and approved the data. Such information is especially important at the bottom Observation level.
Data access
CountryData.io is an API-first platform, and we don’t provide data in any other format. Internally, we use the API to visualise and distribute data on our CountryRisk.io Insights platform. You can find API documentation for all available endpoints here.
If you’d like access credentials so you can try out the API, or would like to know more about how we process data for our platforms, feel free to email us at [email protected].